本頁內容適用於 Apigee 和 Apigee Hybrid。
查看
Apigee Edge 說明文件。

在異常事件資訊主頁中發現異常狀況時,您可以在 API 監控資訊主頁中進一步調查。資訊主頁會顯示近期 API 資料的圖表和表格,提供異常狀況發生時 API 的詳細資訊。
以下各節提供範例,說明如何調查資訊主頁中的異常狀況。
範例:故障代碼異常
假設您正在查看「異常事件」資訊主頁,並注意到下列異常狀況:
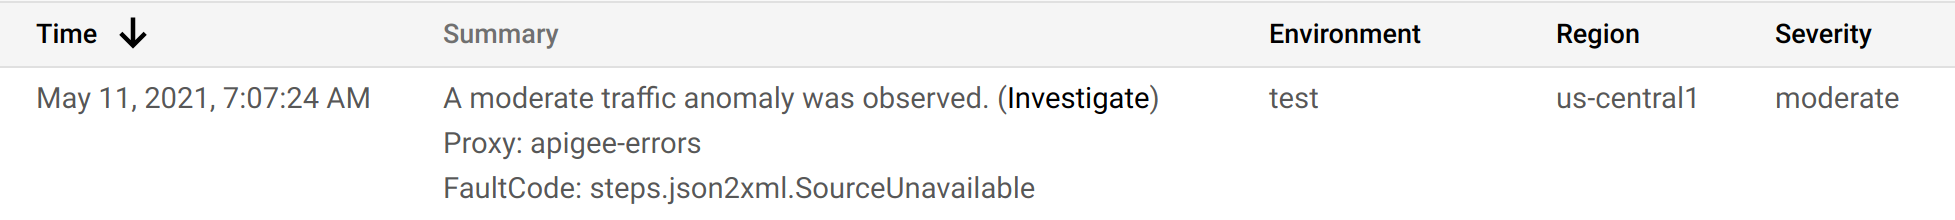
如要查看異常狀況的詳細資料,請按一下「摘要」欄中的「調查」。 畫面上會顯示 API 監控調查資訊主頁,如下所示。

「異常事件詳細資料」窗格會顯示錯誤率的時間軸。 圖表顯示,異常狀況發生在上午 7 點後,當時錯誤率從不到 0.4 升至超過 0.8。
時間軸圖表中的錯誤率包含所有故障代碼的錯誤。 如要查看不同故障代碼的錯誤明細,請查看時間軸下方顯示的「依時間顯示故障代碼」圖表。
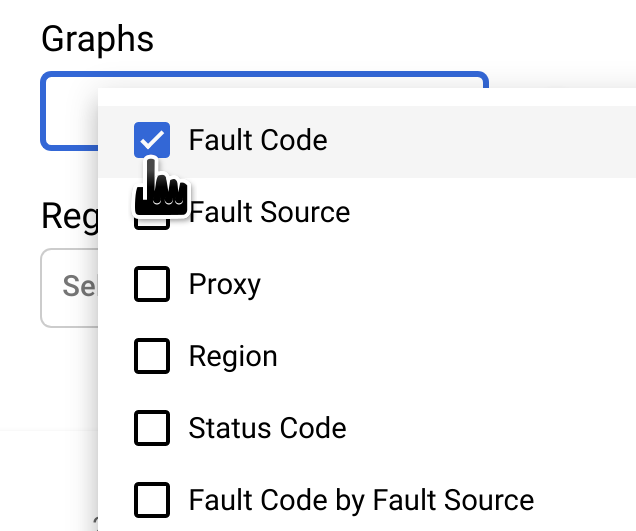
注意:如果目前未顯示「Fault Code by Time」圖表,請在「Graphs」選單中選取「Fault Code」,即可顯示該圖表:
「依時間顯示故障代碼」圖表中以圓圈標示的資料欄,對應包含異常時間的時間間隔。
注意:圖表顯示的資料與異常狀況回報時間之間有少許差異是正常現象。

您發現間隔 07:03 - 07:27 內有 1499 個回應含有錯誤代碼 steps.json2xml.SourceUnavailable (JSON 轉 XML 政策訊息來源無法使用時傳回的錯誤代碼)。這是觸發異常的故障代碼。
相較之下,前四個間隔的平均回應數約為 291,因此跳到 1499 絕對是不尋常的事件。
如要進一步瞭解 SourceUnavailable 錯誤訊息,請參閱「
JSON to XML policy runtime error troubleshooting」。
此時,您可以透過下列幾種方式,繼續調查異常狀況的原因:
在「依時間顯示故障代碼」圖表中,按一下異常狀況的儲存格,即可深入瞭解異常狀況發生時的故障代碼資料。
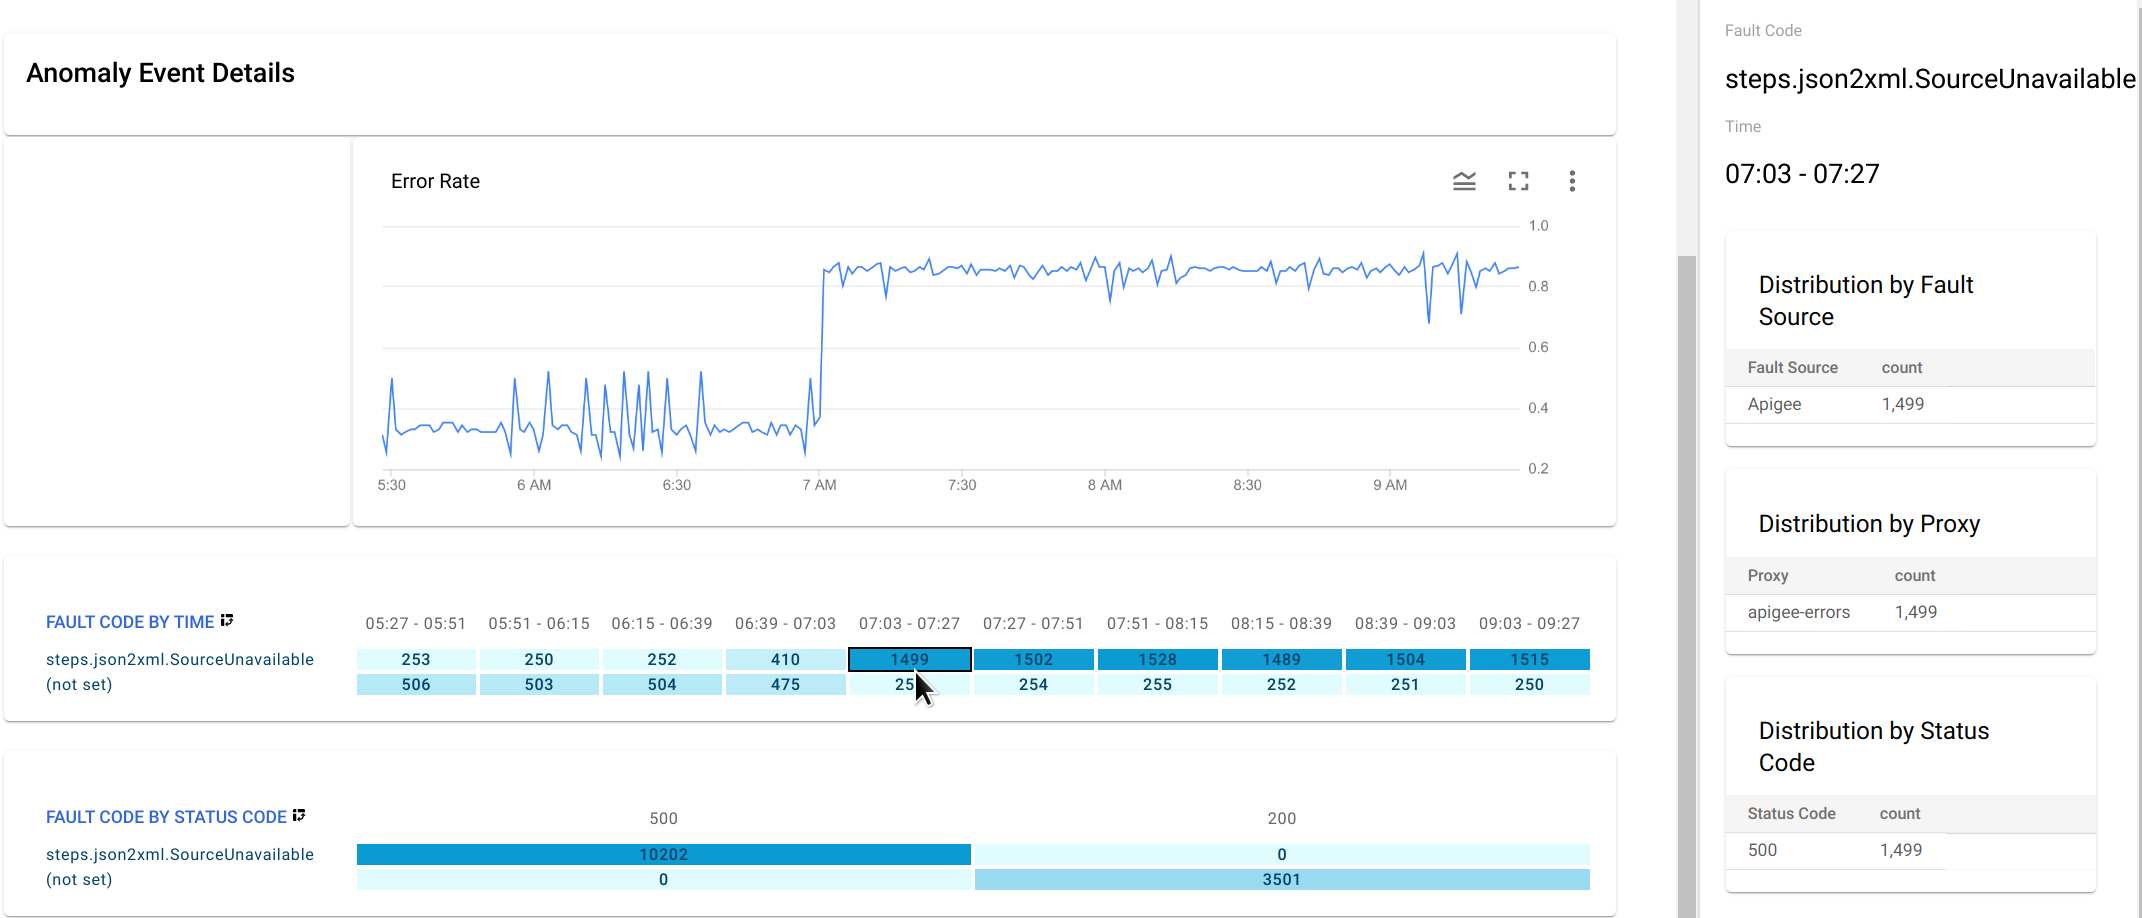
右側窗格會顯示按錯誤來源、Proxy 和狀態碼分類的分配表。
steps.json2xml.SourceUnavailable在本例中,由於所有錯誤代碼都來自相同的錯誤來源、Proxy 和狀態碼,因此表格不會提供任何額外資訊。但在其他情況下,分配資料表可以指出異常狀況的位置和原因。
- 建立異常狀況快訊並設定通知。完成這項操作後,日後發生類似事件時,AAPI Ops 就會傳送訊息給你。