O painel de eventos de anomalias na IU da Apigee é a principal fonte de informações sobre
anomalias de API detectadas. O painel exibe uma lista de anomalias recentes.
Antes de abrir o painel, verifique se você recebeu os
papéis necessários
para as operações da API.
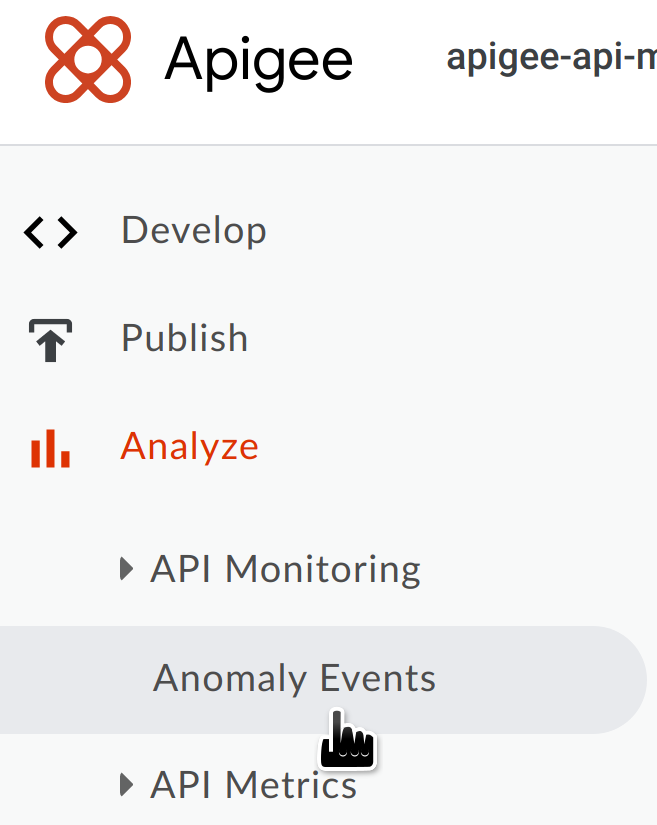
No painel de navegação, selecione Analisar > Eventos de anomalias.
Isso exibe o painel Eventos de anomalias.
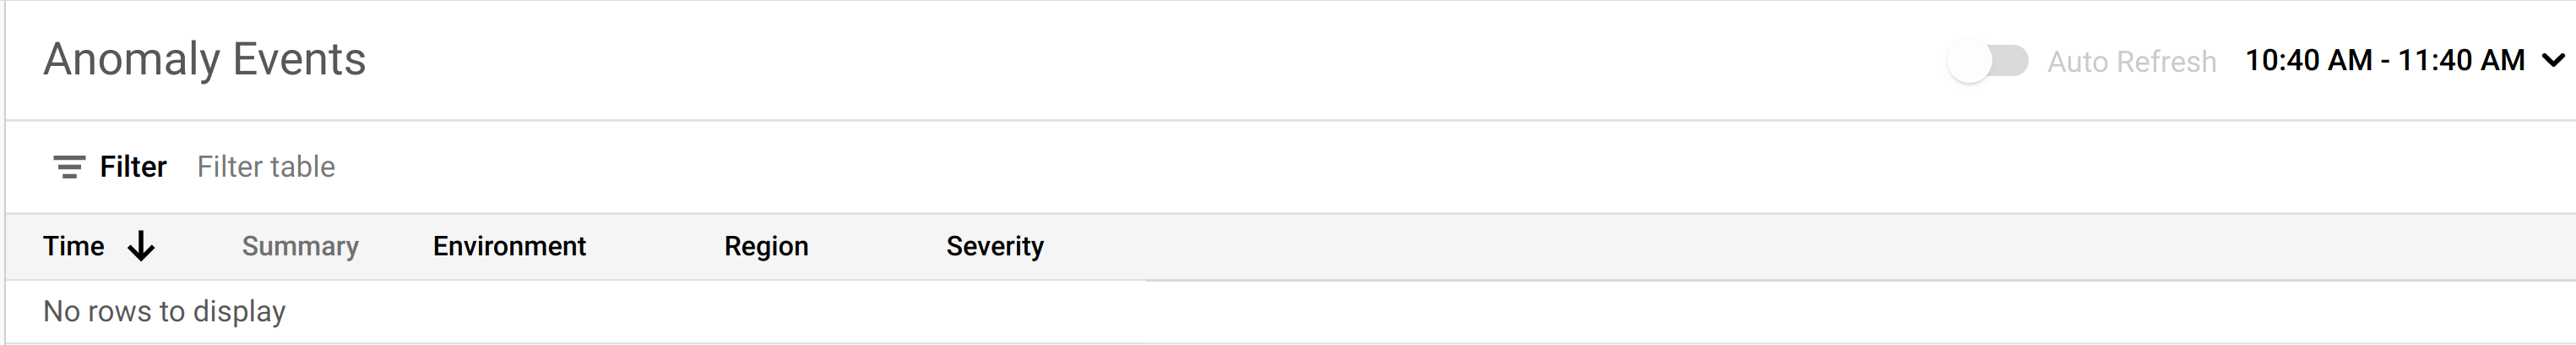
Por padrão, o painel mostra anomalias que ocorreram na hora anterior.
Se nenhuma anomalia for detectada durante esse período, nenhuma linha será
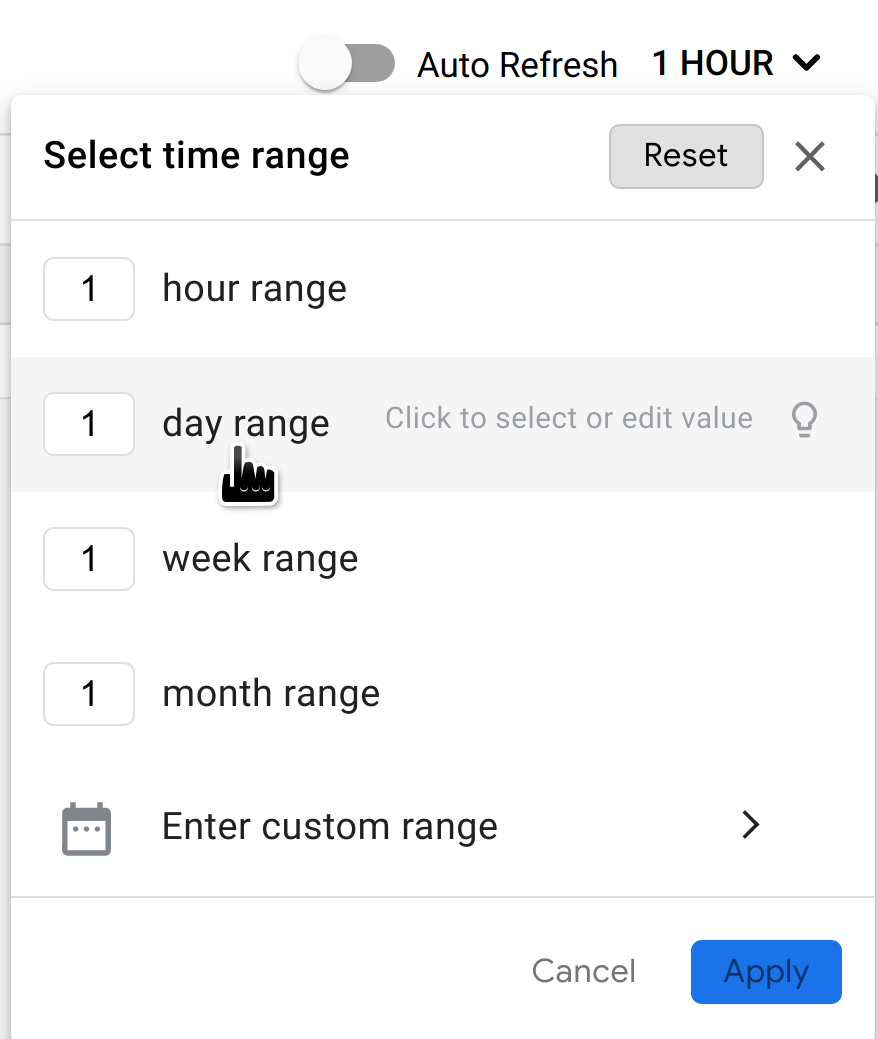
exibida no painel. Nesse caso, é possível selecionar um período maior no
menu de intervalo de tempo no canto superior direito do painel.
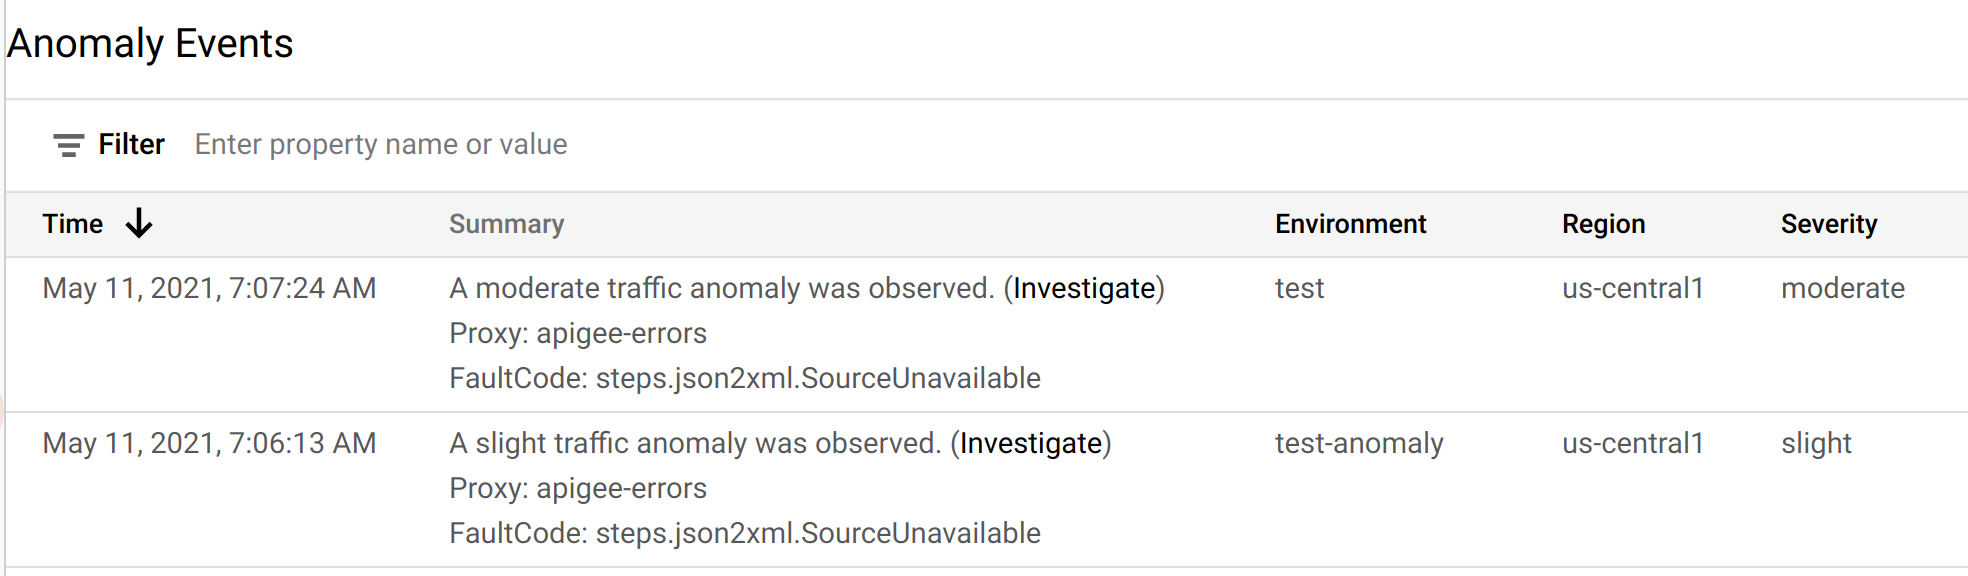
Se houver anomalias neste período, elas serão exibidas de maneira semelhante àquelas mostradas
abaixo.
Cada linha na tabela corresponde a uma anomalia detectada
e exibe as seguintes informações:
A data e hora da anomalia.
Um breve resumo da anomalia, incluindo o proxy em que ocorreu e o código da falha que a acionou.
O ambiente em que a anomalia ocorreu.
A região em que a anomalia ocorreu.
A gravidade do evento da anomalia: leve, moderada ou grave. A gravidade é
baseada em uma medida estatística (valor p) da chance do
evento ocorrer por probabilidade (quanto mais improvável o evento, maior a gravidade).
Você pode investigar melhor uma anomalia para
determinar quais ações, se houver, devem ser respondidas.
O melhor lugar para começar sua investigação é nos
painéis do Monitoring da API, onde é possível ver vários gráficos de dados de tráfego recentes
da API. A próxima seção,
Investigar anomalias, descreve como fazer isso.
[[["Fácil de entender","easyToUnderstand","thumb-up"],["Meu problema foi resolvido","solvedMyProblem","thumb-up"],["Outro","otherUp","thumb-up"]],[["Difícil de entender","hardToUnderstand","thumb-down"],["Informações incorretas ou exemplo de código","incorrectInformationOrSampleCode","thumb-down"],["Não contém as informações/amostras de que eu preciso","missingTheInformationSamplesINeed","thumb-down"],["Problema na tradução","translationIssue","thumb-down"],["Outro","otherDown","thumb-down"]],["Última atualização 2025-08-28 UTC."],[[["\u003cp\u003eThis page covers anomaly detection in Apigee and Apigee hybrid, focusing on the Anomaly Events dashboard in the Apigee UI.\u003c/p\u003e\n"],["\u003cp\u003eTo view anomalies, users must be subscribed to AAPI Ops and have the \u003ccode\u003eroles/logging.viewer\u003c/code\u003e role, along with other required AAPI Ops roles.\u003c/p\u003e\n"],["\u003cp\u003eThe Anomaly Events dashboard displays recent API anomalies, including details such as the date, time, summary, environment, region, and severity.\u003c/p\u003e\n"],["\u003cp\u003eThe dashboard defaults to showing anomalies from the previous hour, but users can adjust the time range to view anomalies from a different period.\u003c/p\u003e\n"],["\u003cp\u003eDetected anomalies in the dashboard can be further investigated in the API Monitoring dashboards to determine appropriate actions.\u003c/p\u003e\n"]]],[],null,["# Using the Anomaly Events dashboard\n\n*This page\napplies to **Apigee** and **Apigee hybrid**.*\n\n\n*View [Apigee Edge](https://docs.apigee.com/api-platform/get-started/what-apigee-edge) documentation.*\n\n| **Important:** \"Anomaly Detection\" describes the Advanced API Operations Anomaly Detection functionality, which is available in the Classic Apigee UI. This functionality is comparable to the \"Operations Anomalies\" functionality in [Apigee UI in Cloud console](https://console.cloud.google.com/apigee). Both are available at this time. See [Operations Anomalies overview](/apigee/docs/api-platform/analytics/operations-anomalies-overview) for information on the Operations Anomalies functionality.\n\nThe Anomaly Events dashboard in the Apigee UI is your primary source of information about\ndetected API anomalies. The dashboard displays a list of recent anomalies.\n| **Notes:** To view anomalies in the dashboard, you must:\n|\n| - Be subscribed to AAPI Ops. [Contact Apigee](https://cloud.google.com/contact) to learn more.\n| - Be assigned the role `roles/logging.viewer`, in addition to the other [required roles for AAPI Ops](/apigee/docs/aapi-ops#required-roles-for-aapi-ops).\n\nBefore opening the dashboard, make sure you have been assigned the\n[required roles](/apigee/docs/aapi-ops#required-roles-for-aapi-ops)\nfor AAPI Ops.\n\nTo open the anomalies dashboard: \n\n### Apigee in Cloud Console\n\n1. In the Google Cloud console, go to the **Operations anomalies** page.\n\n [Go to Operations anomalies](https://console.cloud.google.com/apigee/analytics/operations-anomalies)\n2. [Switch to\n the organization](/apigee/docs/api-platform/get-started/switch-org) that you want to monitor.\n\nBy default, the dashboard shows anomalies that have occurred during the previous hour.\nIf no anomalies have been detected during that time period, no rows are\ndisplayed in the dashboard. In that case, you can select a larger time range from\nthe time range menu in the top right of the dashboard.\n\nEach row in the table corresponds to a detected anomaly,\nand displays the following information:\n\n- The date and time of the anomaly.\n- A brief summary of the anomaly, including the proxy in which it occurred and the fault code that triggered it.\n- The environment in which the anomaly occurred.\n- The region where the anomaly occurred.\n- The severity of the anomaly event: slight, moderate, or severe. Severity is based on a statistical measure (p-value) of how unlikely it would be for the event to occur by chance (the more unlikely the event, the greater its severity).\n\nYou can further investigate an anomaly to\ndetermine what actions, if any, you should take in response.\nThe best place to start your investigation is in the\nAPI Monitoring dashboards, where you can see various graphs of recent API traffic\ndata. The next section, [Investigating anomalies](/apigee/docs/aapi-ops/investigate-anomalies), describes how to do this.\n\n### Classic UI\n\n1. Sign in to [Apigee UI](https://apigee.google.com).\n\n **Note:** Open the Apigee UI in a new tab if you want to\n follow the steps below.\n2. [Switch to the organization](/apigee/docs/api-platform/get-started/switch-org) that you want to monitor.\n3. In the navigation pane, select **Analyze \\\u003e Anomaly Events** .\n\n\nThis displays the Anomaly Events dashboard.\n\nBy default, the dashboard shows anomalies that have occurred during the previous hour.\nIf no anomalies have been detected during that time period, no rows are\ndisplayed in the dashboard. In that case, you can select a larger time range from\nthe time range menu in the top right of the dashboard.\n\nIf there are anomalies in this time range, they are displayed similarly to the ones shown\nbelow.\n\nEach row in the table corresponds to a detected anomaly,\nand displays the following information:\n\n- The date and time of the anomaly.\n- A brief summary of the anomaly, including the proxy in which it occurred and the fault code that triggered it.\n- The environment in which the anomaly occurred.\n- The region where the anomaly occurred.\n- The severity of the anomaly event: slight, moderate, or severe. Severity is based on a statistical measure (p-value) of how unlikely it would be for the event to occur by chance (the more unlikely the event, the greater its severity).\n\nYou can further investigate an anomaly to\ndetermine what actions, if any, you should take in response.\nThe best place to start your investigation is in the\nAPI Monitoring dashboards, where you can see various graphs of recent API traffic\ndata. The next section, [Investigating anomalies](/apigee/docs/aapi-ops/investigate-anomalies), describes how to do this."]]