Mit Sammlungen den Überblick behalten
Sie können Inhalte basierend auf Ihren Einstellungen speichern und kategorisieren.
Wenn Sie einen Job ausführen, verwendet Model Monitoring v2 Daten aus Ihren Ziel- und Baseline-Datasets, berechnet Messwerte und generiert möglicherweise Benachrichtigungen. Model Monitoring v2 bietet On-Demand-Jobs für Ad-hoc-Monitoring oder geplante Jobs für kontinuierliches Monitoring. Unabhängig von der gewählten Option ist jeder Job eine einzelne Batchausführung.
Einmaligen Monitoring-Job ausführen Legen Sie die Ziel- und Baseline-Datasets sowie die Monitoring-Spezifikationen für die zu überwachenden Zielvorhaben fest. Mit Ihrer Konfiguration werden alle vom Modellmonitor definierten Standardeinstellungen überschrieben, sofern vorhanden.
Console
Rufen Sie in der Google Cloud Console die Seite Monitoring auf.
Klicken Sie auf den Modellmonitor, für den Sie einen Monitoring-Job ausführen möchten.
Klicken Sie auf der Seite mit den Details zum Modellmonitor auf Jetzt ausführen, um den Monitoring-Job zu konfigurieren.
Konfigurieren Sie den Job oder verwenden Sie die im Modellmonitor definierten Standardeinstellungen.
Klicken Sie auf Ausführen.
Python SDK
fromvertexai.resources.previewimportml_monitoringFEATURE_THRESHOLDS={"culmen_length_mm":0.001,"body_mass_g":0.002,}FEATURE_DRIFT_SPEC=ml_monitoring.spec.DataDriftSpec(categorical_metric_type="l_infinity",numeric_metric_type="jensen_shannon_divergence",default_categorical_alert_threshold=0.001,default_numeric_alert_threshold=0.002,feature_alert_thresholds=FEATURE_THRESHOLDS,)PREDICTION_OUTPUT_DRIFT_SPEC=ml_monitoring.spec.DataDriftSpec(categorical_metric_type="l_infinity",numeric_metric_type="jensen_shannon_divergence",default_categorical_alert_threshold=0.001,default_numeric_alert_threshold=0.001,)FEATURE_ATTRIBUTION_SPEC=ml_monitoring.spec.FeatureAttributionSpec(default_alert_threshold=0.0003,feature_alert_thresholds={"cnt_ad_reward":0.0001},)EXPLANATION_SPEC=ExplanationSpec(parameters=ExplanationParameters({"sampled_shapley_attribution":{"path_count":2}}),metadata=ExplanationMetadata(inputs={"cnt_ad_reward":ExplanationMetadata.InputMetadata({"input_tensor_name":"cnt_ad_reward","encoding":"IDENTITY","modality":"numeric"}),...},...))TRAINING_DATASET=ml_monitoring.spec.MonitoringInput(gcs_uri=TRAINING_URI,data_format="csv")TARGET_DATASET=ml_monitoring.spec.MonitoringInput(table_uri=BIGQUERY_URI)model_monitoring_job=my_model_monitor.run(display_name=JOB_DISPLAY_NAME,baseline_dataset=TRAINING_DATASET,target_dataset=TARGET_DATASET,tabular_objective_spec=ml_monitoring.spec.TabularObjective(# Optional: set to monitor input feature drift.feature_drift_spec=FEATURE_DRIFT_SPEC,# Optional: set to monitor prediction output drift.prediction_output_drift_spec=PREDICTION_OUTPUT_DRIFT_SPEC,# Optional: set to monitor feature attribution drift.feature_attribution_spec=FEATURE_ATTRIBUTION_SPEC),# Optional: additional configurations to override default values.explanation_config=EXPLANATION_SPEC,notification_spec=NOTIFICATION_SPEC,output_spec=OUTPUT_SPEC)
Kontinuierliche Ausführungen planen
Sie können eine oder mehrere geplante Ausführungen für einen Modellmonitor festlegen. Wenn Sie ein kontinuierliches Monitoring mit Zeitangaben verwenden möchten, muss Ihr Dataset eine Zeitstempelspalte haben, damit Model Monitoring v2 die Daten aus dem angegebenen Zeitraum abrufen kann.
Console
Rufen Sie in der Google Cloud Console die Seite Monitoring auf.
Klicken Sie auf den Modellmonitor, für den Sie ein kontinuierliches Monitoring konfigurieren möchten.
Klicken Sie auf Wiederkehrende Ausführung planen.
Legen Sie die Ziel- und Kontrolldatensätze fest und klicken Sie dann auf Weiter.
Legen Sie die zu überwachenden Zielvorhaben, ihre Grenzwerte sowie die Benachrichtigungseinstellungen fest, wenn eine Benachrichtigung generiert wird.
Klicken Sie auf Weiter.
Zeitplan für wiederkehrende Jobs konfigurieren:
Geben Sie einen Namen für den Scheduler an.
Geben Sie unter Startzeit an, wann der erste Job gestartet werden soll.
Verwenden Sie für Häufigkeit einen Cron-Ausdruck, um die Häufigkeit zu bestimmen, und legen Sie dann die Zeitzone fest.
Geben Sie unter Ende an, wann der Scheduler endet.
Klicken Sie auf Erstellen.
Python SDK
Verwenden Sie einen Cron-Ausdruck, um die Häufigkeit von Monitoring-Jobs festzulegen.
my_model_monitoring_schedule=my_model_monitor.create_schedule(display_name=SCHEDULE_DISPLAY_NAME,# Every day at 0:00(midnight)cron='"0 * * * *"',baseline_dataset=ml_monitoring.spec.MonitoringInput(endpoints=[ENDPOINT_RESOURCE_NAME],offset="24h",window="24h",),target_dataset=ml_monitoring.spec.MonitoringInput(endpoints=[ENDPOINT_RESOURCE_NAME],window="24h"),tabular_objective_spec=ml_monitoring.spec.TabularObjective(# Optional: set to monitor input feature drift.feature_drift_spec=FEATURE_DRIFT_SPEC,# Optional: set to monitor prediction output drift.prediction_output_drift_spec=PREDICTION_OUTPUT_DRIFT_SPEC,# Optional: set to monitor feature attribution drift.feature_attribution_spec=FEATURE_ATTRIBUTION_SPEC),# Optional: additional configurations to override default values.explanation_config=EXPLANATION_SPEC,output_spec=OUTPUT_SPEC,notification_spec=NOTIFICATION_SPEC,)
Zeitplan pausieren oder fortsetzen
Sie können einen Zeitplan pausieren und fortsetzen, um Monitoringjobs zu überspringen oder vorübergehend anzuhalten.
Console
Rufen Sie in der Google Cloud Console die Seite Monitoring auf.
Sie können die Google Cloud Console verwenden, um die Datenverteilungen für jedes Monitoring-Ziel zu visualisieren und zu ermitteln, welche Änderungen im Zeitverlauf zu Abweichungen geführt haben.
Die Visualisierungen zeigen ein Histogramm, in dem die Datenverteilung zwischen den Ziel- und den Baseline-Daten verglichen wird. Je nach Toleranz können Sie beispielsweise die Pipeline für die Funktionsgenerierung anpassen oder das Modell neu trainieren.
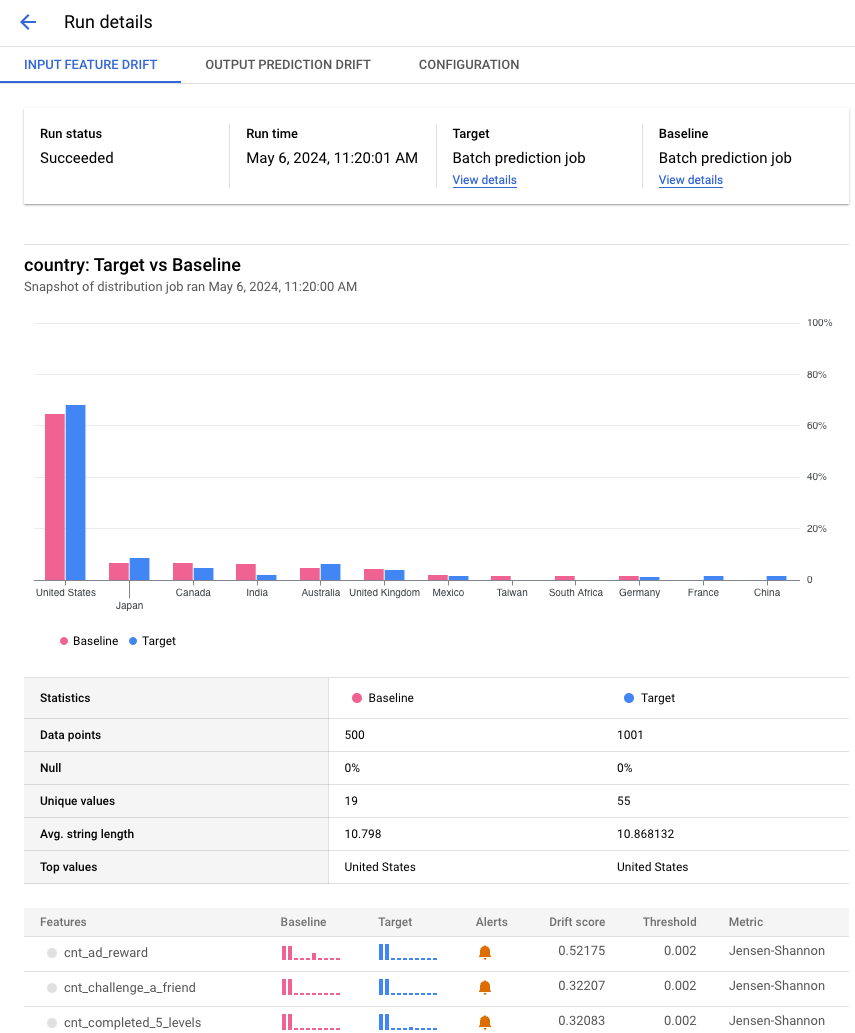
Auftragsdetails aufrufen
Sie können sich Details zu einem ausgeführten Monitoring-Job ansehen, z. B. eine Liste der überwachten Funktionen und welche Funktionen eine Benachrichtigung generiert haben.
Console
Rufen Sie in der Google Cloud Console die Seite Monitoring auf.
Klicken Sie auf den Modellmonitor, der den zu analysierenden Job enthält.
Klicken Sie auf der Seite Monitordetails auf den Tab Ausführungen.
Klicken Sie in der Liste der Ausführungen auf eine Ausführung, um Details wie alle in einer Ausführung enthaltenen Features aufzurufen.
Das folgende Beispiel zeigt einen Verteilungsvergleich für das Attribut Land aus Jobs für die Batch-Vorhersage. In der Google Cloud Console finden Sie je nach Messwert auch Details zum Vergleich, z. B. die Anzahl der eindeutigen Werte, den Mittelwert und die Standardabweichung.
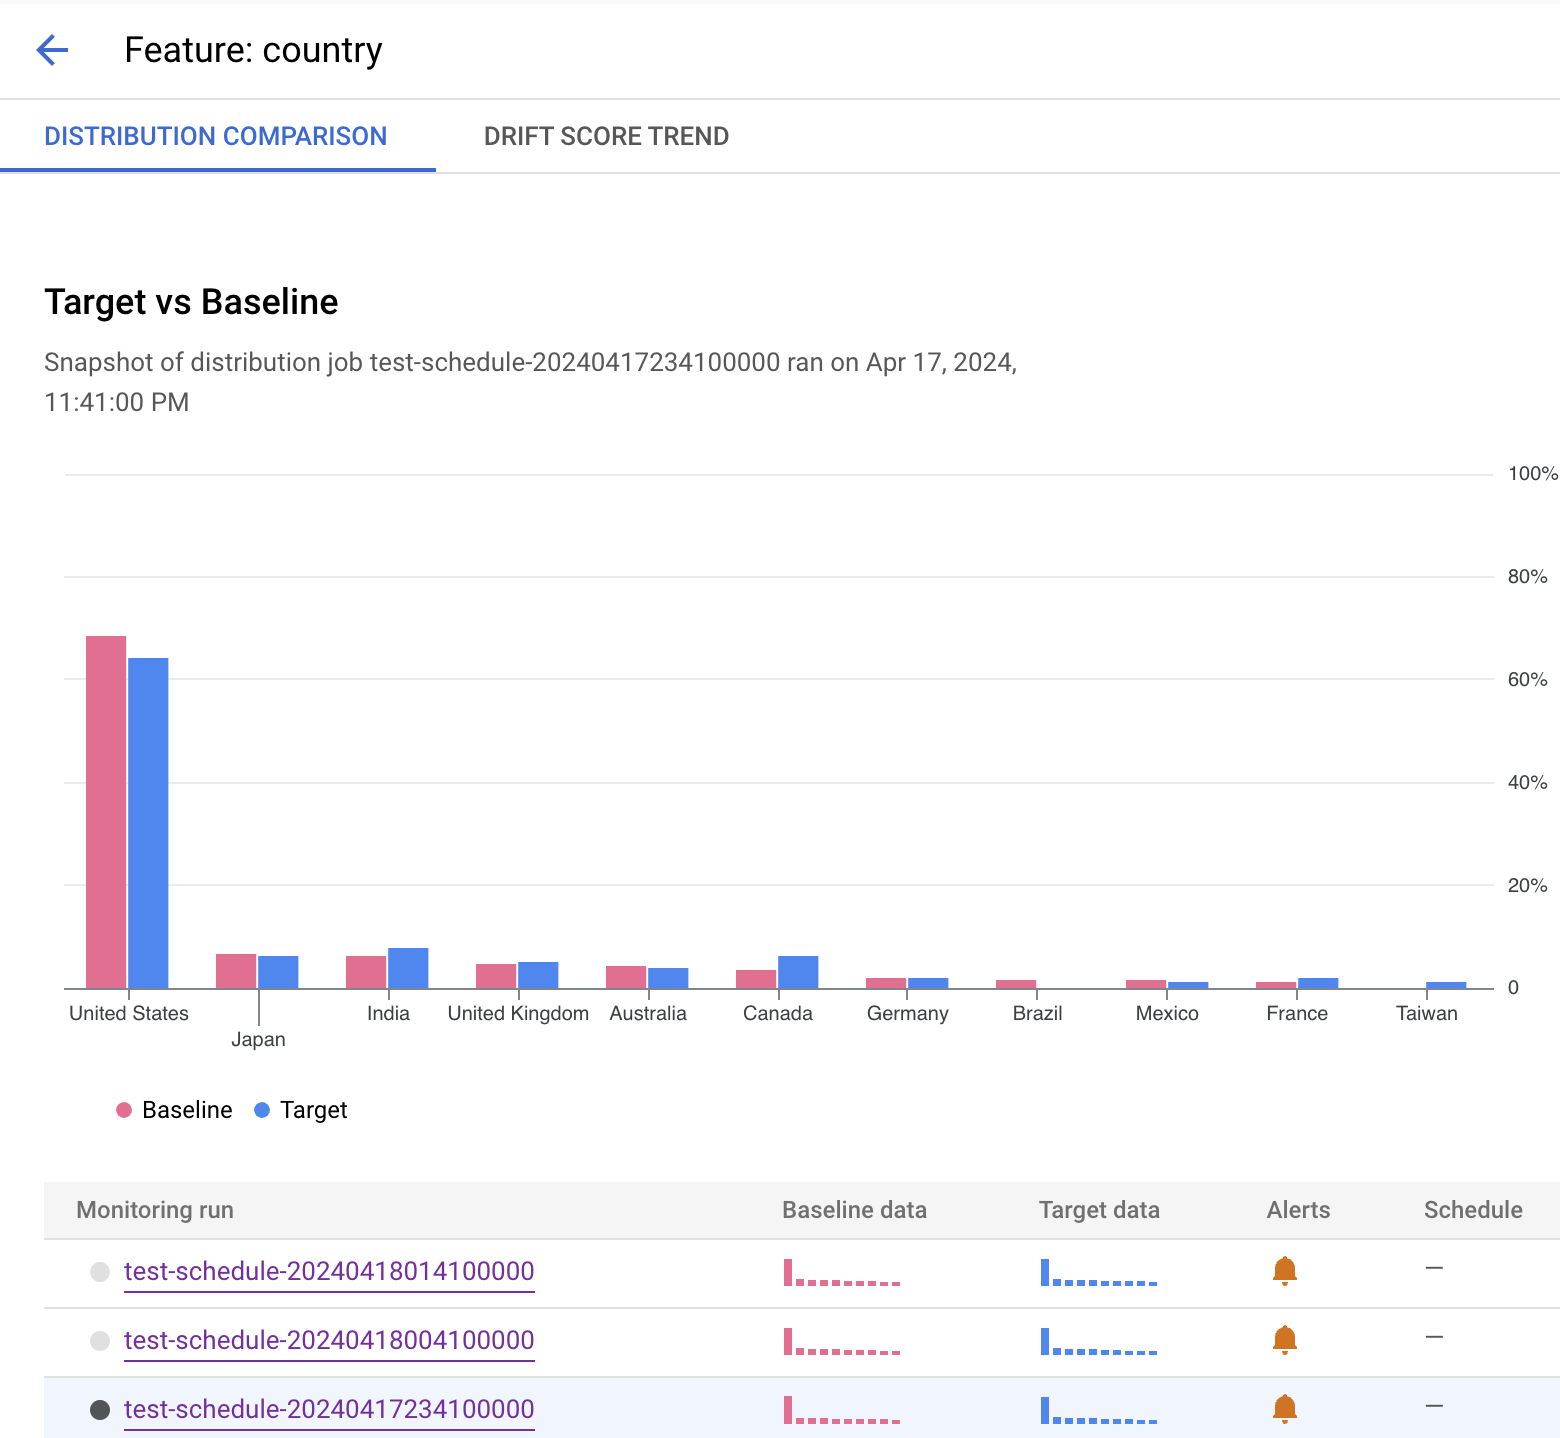
Featuredetails ansehen
Informationen zu einem Element und eine Liste der Monitoring-Jobs, die das Element enthalten.
Console
Rufen Sie in der Google Cloud Console die Seite Monitoring auf.
Klicken Sie auf den Modellmonitor, der die zu analysierenden Jobs enthält.
Im Tab Übersicht sehen Sie eine Zusammenfassung mit den Abweichungstrends aller beobachteten Zielvorhaben, sofern Sie das kontinuierliche Monitoring eingerichtet haben. Sie können sich auch bestimmte Zielvorhaben genauer ansehen, um Details wie die Namen der überwachten Funktionen und eine Liste der Monitoringausführungen zu sehen.
Das folgende Beispiel zeigt einen Verteilungsvergleich für das Land-Attribut. Nach dem Histogramm sehen Sie, für welche Ausführungen eine Benachrichtigung generiert wurde, oder Sie können einen anderen Monitoring-Job auswählen, der Monitoring-Daten für dieses Feature enthält.
[[["Leicht verständlich","easyToUnderstand","thumb-up"],["Mein Problem wurde gelöst","solvedMyProblem","thumb-up"],["Sonstiges","otherUp","thumb-up"]],[["Schwer verständlich","hardToUnderstand","thumb-down"],["Informationen oder Beispielcode falsch","incorrectInformationOrSampleCode","thumb-down"],["Benötigte Informationen/Beispiele nicht gefunden","missingTheInformationSamplesINeed","thumb-down"],["Problem mit der Übersetzung","translationIssue","thumb-down"],["Sonstiges","otherDown","thumb-down"]],["Zuletzt aktualisiert: 2025-08-28 (UTC)."],[],[],null,["# Run monitoring jobs\n\n| **Preview**\n|\n|\n| This product or feature is subject to the \"Pre-GA Offerings Terms\" in the General Service Terms section\n| of the [Service Specific Terms](/terms/service-terms#1).\n|\n| Pre-GA products and features are available \"as is\" and might have limited support.\n|\n| For more information, see the\n| [launch stage descriptions](/products#product-launch-stages).\n\nWhen you run a job, Model Monitoring v2 consumes data from your target and baseline datasets,\ncalculates metrics, and potentially generates alerts. Model Monitoring v2 offers on-demand\njobs for ad hoc monitoring or scheduled jobs for continuous monitoring. No\nmatter which option you choose, each job is a single batch execution.\n\nFor more information about monitoring objectives and supported models, see\n[Model Monitoring v2 overview](/vertex-ai/docs/model-monitoring/overview#v2) and [Set up model monitoring](/vertex-ai/docs/model-monitoring/set-up-model-monitoring).\n\nRun a job on demand\n-------------------\n\nRun a one-time monitoring job. Set the target and baseline datasets as well as\nthe monitoring specs for the objectives to monitor. Your configuration overrides\nany defaults, if set, that are defined by the model monitor. \n\n### Console\n\n1. In the Google Cloud console, go to the **Monitoring** page.\n\n [Go to Monitoring](https://console.cloud.google.com/vertex-ai/model-monitoring/model-monitors)\n2. Click the model monitor that you want to run a monitoring job for.\n\n3. On the model monitor details page, click **Run now** to configure the\n monitoring job.\n\n4. Configure your job or use the defaults as defined in the model monitor.\n\n5. Click **Run**.\n\n### Python SDK\n\n```python\nfrom vertexai.resources.preview import ml_monitoring\n\nFEATURE_THRESHOLDS = {\n \"culmen_length_mm\": 0.001,\n \"body_mass_g\": 0.002,\n}\n\nFEATURE_DRIFT_SPEC=ml_monitoring.spec.DataDriftSpec(\n categorical_metric_type=\"l_infinity\",\n numeric_metric_type=\"jensen_shannon_divergence\",\n default_categorical_alert_threshold=0.001,\n default_numeric_alert_threshold=0.002,\n feature_alert_thresholds=FEATURE_THRESHOLDS,\n)\n\nPREDICTION_OUTPUT_DRIFT_SPEC=ml_monitoring.spec.DataDriftSpec(\n categorical_metric_type=\"l_infinity\",\n numeric_metric_type=\"jensen_shannon_divergence\",\n default_categorical_alert_threshold=0.001,\n default_numeric_alert_threshold=0.001,\n)\n\nFEATURE_ATTRIBUTION_SPEC=ml_monitoring.spec.FeatureAttributionSpec(\n default_alert_threshold=0.0003,\n feature_alert_thresholds={\"cnt_ad_reward\":0.0001},\n)\n\nEXPLANATION_SPEC=ExplanationSpec(\n parameters=ExplanationParameters(\n {\"sampled_shapley_attribution\": {\"path_count\": 2}}\n ),\n metadata=ExplanationMetadata(\n inputs={\n \"cnt_ad_reward\": ExplanationMetadata.InputMetadata({\n \"input_tensor_name\": \"cnt_ad_reward\",\n \"encoding\": \"IDENTITY\",\n \"modality\": \"numeric\"\n }),\n ...\n },\n ...\n )\n)\n\nTRAINING_DATASET=ml_monitoring.spec.MonitoringInput(\n gcs_uri=TRAINING_URI,\n data_format=\"csv\"\n)\n\nTARGET_DATASET=ml_monitoring.spec.MonitoringInput(\n table_uri=BIGQUERY_URI\n)\n\nmodel_monitoring_job=my_model_monitor.run(\n display_name=JOB_DISPLAY_NAME,\n baseline_dataset=TRAINING_DATASET,\n target_dataset=TARGET_DATASET,\n tabular_objective_spec=ml_monitoring.spec.TabularObjective(\n # Optional: set to monitor input feature drift.\n feature_drift_spec=FEATURE_DRIFT_SPEC,\n\n # Optional: set to monitor prediction output drift.\n prediction_output_drift_spec=PREDICTION_OUTPUT_DRIFT_SPEC,\n\n # Optional: set to monitor feature attribution drift.\n feature_attribution_spec=FEATURE_ATTRIBUTION_SPEC\n ),\n\n # Optional: additional configurations to override default values.\n explanation_config=EXPLANATION_SPEC,\n notification_spec=NOTIFICATION_SPEC,\n output_spec=OUTPUT_SPEC\n)\n```\n\nSchedule continuous runs\n------------------------\n\nYou can set one or more schedule runs for a model monitor. To use continuous\nmonitoring with time specifications, your dataset must have a timestamp column\nso that Model Monitoring v2 can retrieve the data from the specified time range. \n\n### Console\n\n1. In the Google Cloud console, go to the **Monitoring** page.\n\n [Go to Monitoring](https://console.cloud.google.com/vertex-ai/model-monitoring/model-monitors)\n2. Click the model monitor that you want to configure continuous monitoring\n for.\n\n3. Click **Schedule a recurring run**.\n\n4. Set your target and baseline datasets and then click **Continue**.\n\n5. Set the objectives to monitor, their thresholds, notification settings when\n an alert is generated.\n\n6. Click **Continue**.\n\n7. Configure a schedule for recurring jobs:\n\n 1. Specify a name for the scheduler.\n 2. For **Start time**, specify when the first job will start.\n 3. For **Frequency** , use a [cron expression](/scheduler/docs/configuring/cron-job-schedules) to set the frequency, and then set the time zone.\n 4. For **Ends**, specify when the scheduler ends.\n8. Click **Create**.\n\n### Python SDK\n\nTo set the frequency of monitoring jobs, use a [cron expression](/scheduler/docs/configuring/cron-job-schedules). \n\n```python\nmy_model_monitoring_schedule=my_model_monitor.create_schedule(\n display_name=SCHEDULE_DISPLAY_NAME,\n # Every day at 0:00(midnight)\n cron='\"0 * * * *\"',\n baseline_dataset=ml_monitoring.spec.MonitoringInput(\n endpoints=[ENDPOINT_RESOURCE_NAME],\n offset=\"24h\",\n window=\"24h\",\n ),\n target_dataset=ml_monitoring.spec.MonitoringInput(\n endpoints=[ENDPOINT_RESOURCE_NAME],\n window=\"24h\"\n ),\n tabular_objective_spec=ml_monitoring.spec.TabularObjective(\n # Optional: set to monitor input feature drift.\n feature_drift_spec=FEATURE_DRIFT_SPEC,\n\n # Optional: set to monitor prediction output drift.\n prediction_output_drift_spec=PREDICTION_OUTPUT_DRIFT_SPEC,\n\n # Optional: set to monitor feature attribution drift.\n feature_attribution_spec=FEATURE_ATTRIBUTION_SPEC\n ),\n\n # Optional: additional configurations to override default values.\n explanation_config=EXPLANATION_SPEC,\n output_spec=OUTPUT_SPEC,\n notification_spec=NOTIFICATION_SPEC,\n)\n```\n\n### Pause or resume a schedule\n\nYou can pause and resume a schedule to skip or temporarily halt monitoring job\nruns. \n\n### Console\n\n1. In the Google Cloud console, go to the **Monitoring** page.\n\n [Go to Monitoring](https://console.cloud.google.com/vertex-ai/model-monitoring/model-monitors)\n2. Click the model monitor that contains the schedule to modify.\n\n3. On the details page, go to the **Schedules** tab.\n\n4. Click the schedule to modify.\n\n5. Click **Pause** or **Resume** to pause or resume the schedule.\n\n### Python SDK\n\n```python\n# Pause schedule\nmy_model_monitor.pause_schedule(my_monitoring_schedule.name)\n\n# Resume schedule\nmy_model_monitor.resume_schedule(my_monitoring_schedule.name)\n```\n\n### Delete a schedule\n\nDelete a schedule if you're not using it. Your existing data remains as well as\nany previously created jobs. \n\n### Console\n\n1. In the Google Cloud console, go to the **Monitoring** page.\n\n [Go to Monitoring](https://console.cloud.google.com/vertex-ai/model-monitoring/model-monitors)\n2. Click the model monitor that contains the schedule to modify.\n\n3. On the details page, go to the **Schedules** tab.\n\n4. Click the schedule to modify.\n\n5. Click **Delete** and **Delete** again to confirm.\n\n### Python SDK\n\n```python\nmy_model_monitor.delete_schedule(my_monitoring_schedule.name)\n```\n\nAnalyze monitoring job results\n------------------------------\n\nYou can use the Google Cloud console to visualize the data distributions for\neach monitoring objective and learn which changes led to drift over time.\n\nThe visualizations show a histogram comparing the data distribution between the\ntarget and the baseline data. Based on your level of tolerance, you might,\nfor example, decide to adjust your feature generation pipeline or retrain the\nmodel.\n\n### View job details\n\nView details about a monitoring job run such as a list of monitored features and\nwhich features generated an alert. \n\n### Console\n\n1. In the Google Cloud console, go to the **Monitoring** page.\n\n [Go to Monitoring](https://console.cloud.google.com/vertex-ai/model-monitoring/model-monitors)\n2. Click the model monitor that contains the job to analyze.\n\n3. On the **Monitor details** page, click the **Runs** tab.\n\n4. From the list of runs, click a run to view its details such as all the\n features included in a run.\n\n The following example shows a distribution comparison for the **country**\n feature from batch prediction jobs. The Google Cloud console also\n provide details about the comparison depending on the metric, such as the\n number of unique values, mean value, and the standard deviation.\n\n### View feature details\n\nView information about a feature and a list of monitoring jobs that include the\nfeature. \n\n### Console\n\n1. In the Google Cloud console, go to the **Monitoring** page.\n\n [Go to Monitoring](https://console.cloud.google.com/vertex-ai/model-monitoring/model-monitors)\n2. Click the model monitor that contains the jobs to analyze.\n\n3. In the **Overview** tab, you can view a summary, which includes trends in\n drift for all monitored objectives if you have continuous monitoring\n set up. You can also dive deeper into particular objectives to see details\n such as the monitored feature names and a list of monitoring runs.\n\n The following example shows a distribution comparison for the **country**\n feature. After the histogram, you can see which runs generated an alert or\n select another monitoring job that includes monitoring data for this\n feature."]]