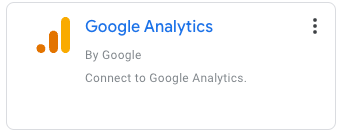
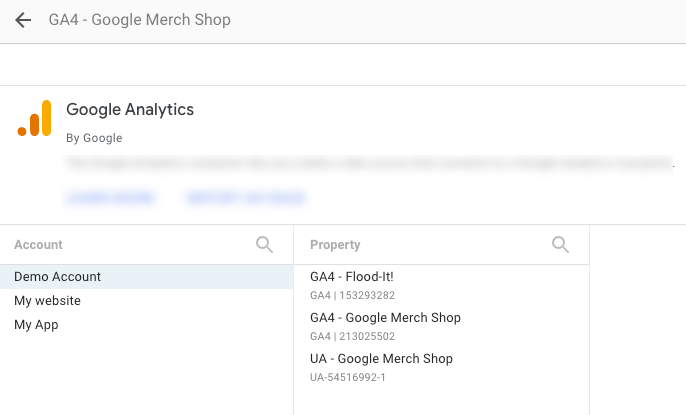
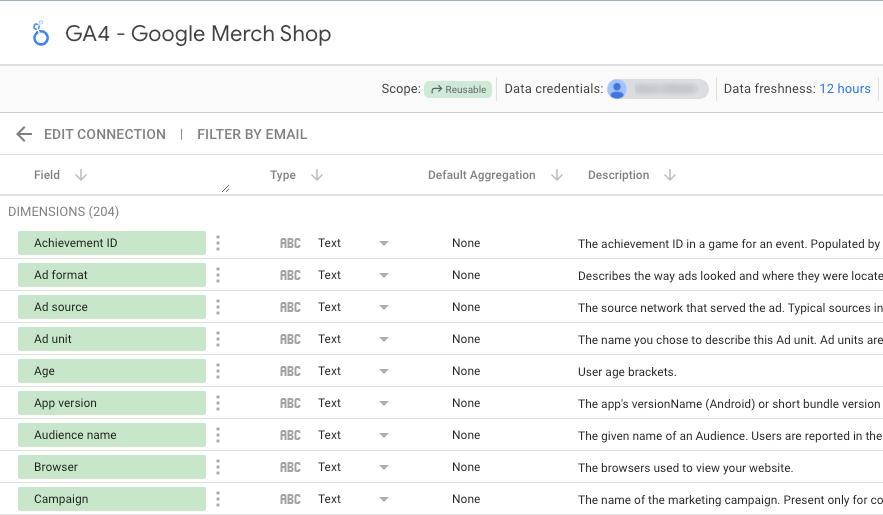
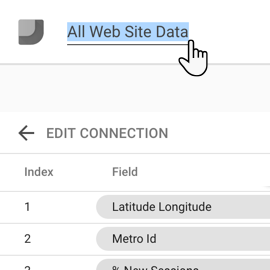
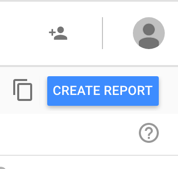
[[["易于理解","easyToUnderstand","thumb-up"],["解决了我的问题","solvedMyProblem","thumb-up"],["其他","otherUp","thumb-up"]],[["很难理解","hardToUnderstand","thumb-down"],["信息或示例代码不正确","incorrectInformationOrSampleCode","thumb-down"],["没有我需要的信息/示例","missingTheInformationSamplesINeed","thumb-down"],["翻译问题","translationIssue","thumb-down"],["其他","otherDown","thumb-down"]],["最后更新时间 (UTC):2025-07-31。"],[],[],null,["# Tutorial: Create a Google Analytics data source\n\nA data source provides the data for a Looker Studio report. In this tutorial, you'll create a reusable data source that connects to one of your Google Analytics accounts.\n\nStep 1: Connect to your Google Analytics account\n------------------------------------------------\n\nThe first step in creating a data source is to connect to your [dataset](/looker/docs/studio/dataset).\n\n1. [Sign in to Looker Studio.](https://lookerstudio.google.com)\n2. On the Looker Studio home page, in the top left, click **Create** , and then select **Data Source**.\n3. In the list of connectors, select **Google Analytics.**\n\n4. If you are prompted to, click **AUTHORIZE** to allow Looker Studio to access you data.\n\n5. Select an account and a property.\n\n6. In the upper right, click **CONNECT**. The data source configuration page appears.\n\nStep 2: Configure the data source\n---------------------------------\n\nThe data source configuration page contains all the dimensions (the green chips) and metrics (the blue chips) from the data set. You can fine-tune the data source by renaming or disabling fields, adding calculated fields, and changing the aggregation and data type.\n\nLearn more about [modeling your data](/looker/docs/studio/model-your-data).\n| **Tip:** To create a basic report that uses Google Analytics data, you usually don't need to make any changes to the data source.\n\n### Data source settings\n\nFor this tutorial, you don't need to change any of the other data source settings.\n\n#### Scope\n\n*Scope* refers to how a data source can be used in a report.\n\nData sources can be either *embedded* or *reusable.* Reports can include both embedded and reusable data sources.\n\n**Data sources that you create while editing a report are embedded** in the report. To edit an embedded data source, you do so within that report. Embedded data sources make collaborating on reports and data sources easier. Anyone who can edit the report can also edit the data source as well as modify its connection. When you share or copy the report, any embedded data sources are shared or copied as well.\n\n**Data sources that you create from the home page are reusable**. You can reuse these data sources in different reports. Reusable data sources let you create and share a consistent data model across your organization. Only people with whom you share the reusable data source can edit it. Only the owner of the data source's credentials can modify the connection.\n\nLearn more about [embedded data sources](/looker/docs/studio/embedded-data-sources).\n\n#### Data credentials\n\nData credentials control access to the data that is provided by this data source:\n\n- **Owner's credentials** uses the credentials of the data source owner to authorize access to the dataset. This option lets you share reports that use this data source without requiring report viewers to have their own access to the underlying dataset.\n\n | **Important:** Before sharing a report or data source that uses Owner's credentials, be sure that you trust the person or persons with whom you share them.\n- **Viewer's credentials** require anyone who attempts to view the data that is provided by this data source to have their own access to the dataset.\n\n- **Service account credentials** use a special type of Google account that is intended to represent a non-human user that can authenticate and be authorized to access your data.\n\n#### Data freshness\n\nData freshness refers to how current the data is in a data source. Different types of data sources have different requirements or expectations for data freshness. [Learn more about data freshness](/looker/docs/studio/manage-data-freshness).\n\n#### Community visualizations access\n\nCommunity visualizations are charts that are created by third-party developers who work with your data. These charts can be configured just like Looker Studio's default charts. Before you can use a community visualization in your report, you need to turn on community visualization access in the data source. [Learn more about community visualizations](/looker/docs/studio/community-visualizations-developer-preview).\n\n#### Field editing in reports\n\nField editing in reports lets report editors change field definitions at the chart level. Editing field definitions in the report makes customizing your reports faster and easier. If you don't want other editors to make changes to the field definitions, you can turn this option off. [Learn more about field editing in reports](/looker/docs/studio/edit-fields-in-your-reports).\n\nStep 3: Name the data source\n----------------------------\n\nLooker Studio automatically gives your data source the same name as your dataset. If you want to change that, click the name in the upper left and enter a new name.\n\nYou can also rename the data source later from the DATA SOURCES home page by clicking the context menu and selecting **Rename**.\n\nStep 4: Share the data source\n-----------------------------\n\nYou can let other editors add this data source to reports by sharing it with them.\n\n### To share a data source\n\n1. In the upper right, click **Share**.\n\n2. Enter the email addresses or Google Groups that you want to share with.\n\n3. For each person or group, select the access (permissions). Permissions determine what other people can do with the data source. Your choices are as follows:\n\n - **Can view**. People with this permission can view but not edit the data source.\n\n - **Can edit**. People with this permission can both view and edit the data source.\n\nStep 5: Use the data source in reports\n--------------------------------------\n\nTo create a report that gets its data from your Google Analytics property, Click **CREATE REPORT**.\n\nRelated resources\n-----------------\n\n- [Google Analytics connector](/looker/docs/studio/connect-to-google-analytics)\n- [Report tutorials](/looker/docs/studio/tutorial-report-intro)\n- [Share a data source](/looker/docs/studio/ways-to-share-your-reports)\n- [Copy a data source](/looker/docs/studio/copy-a-data-source)\n- [Calculated fields](/looker/docs/studio/about-calculated-fields)\n- [Data source credentials](/looker/docs/studio/data-credentials)"]]