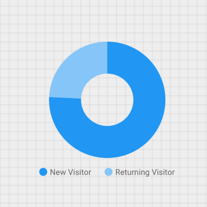
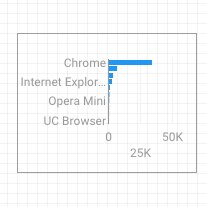
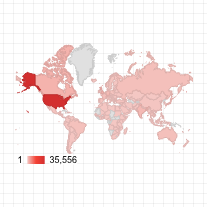
[[["易于理解","easyToUnderstand","thumb-up"],["解决了我的问题","solvedMyProblem","thumb-up"],["其他","otherUp","thumb-up"]],[["很难理解","hardToUnderstand","thumb-down"],["信息或示例代码不正确","incorrectInformationOrSampleCode","thumb-down"],["没有我需要的信息/示例","missingTheInformationSamplesINeed","thumb-down"],["翻译问题","translationIssue","thumb-down"],["其他","otherDown","thumb-down"]],["最后更新时间 (UTC):2025-08-25。"],[],[],null,["# Tutorial: Add charts to your report\n\nUse charts to visualize and explore your data. In this lesson, you'll add a pie chart, a bar chart and a Geo chart to this report.\n| **Important:** This page assumes you are using the `[Sample] Google Analytics Data` [data source](/looker/docs/studio/data-source), as described in the [Create a new report](/looker/docs/studio/tutorial-create-a-new-report) tutorial. If you are using a different data source, you may need to select the appropriate dimensions and metrics for each chart.\n\nHow to add a chart\n------------------\n\nTo add a chart to the current page:\n\n1. Edit your report.\n2. Navigate to the page that will contain the chart.\n3. In the toolbar, click **Add a chart**.\n4. Select the chart you want to add.\n5. Click the canvas to add the chart to the report.\n6. Select one or more charts to move or resize them as needed.\n\nStep 1: Add a pie chart\n-----------------------\n\nUse a pie chart to give a general comparison of a small number of metrics or variables.\n\n[Learn more about pie charts](/looker/docs/studio/pie-chart-reference).\n\n1. Following the steps in \\[How to add a chart\\](#how-to-add-a-chart), add a **Pie Chart** to the report.\n2. In the **Properties** panel, select the **SETUP** tab.\n3. Click the **Source** dimension chip to access the **Dimension Picker**.\n4. Click the **User Type** dimension.\n5. Click the **STYLE** tab.\n6. Use the donut slider to change the solid shape to a ring shape.\n7. Use the **Legend** property to position the metric labels under the pie:\n\n| **Tip:** Use the **Dimension Picker's** search box to find dimensions and metrics quickly:\n\nStep 2: Add a bar chart\n-----------------------\n\nBar charts are great for showing and comparing the magnitude of multiple variables.\n\n[Learn more about bar charts](/looker/docs/studio/bar-chart-and-column-chart-reference).\n\n1. Following the steps in [How to add a chart](#how-to-add-a-chart), add a **Bar Chart** to the report.\n2. In the **Properties** panel, select the **SETUP** tab.\n3. Click the **Source** dimension and change it to **Browser**.\n4. Click the return arrow:\n5. Click the **Sessions** metric and change it to **Users**.\n6. Click the **STYLE** tab.\n7. Change the orientation to **Horizontal** :\n8. Scroll to the **Background and Border** section of the **STYLE** tab.\n9. Set the **Border color** to gray:\n\nStep 3: Add a Google Map\n------------------------\n\nUse a Google Map to see the distribution of sessions (or other metrics) across the world.\n| **Note:** For Google Analyticss data, Looker Studio automatically selects the geographic dimension. If you are using a different data source, be sure it contains a valid geo dimension.\n\n[Learn more about Google Maps](/looker/docs/studio/google-maps-reference).\n\n1. Following the steps in [How to add a chart](#how-to-add-a-chart), add a **Google Map** to the report. Choose the bubble map style.\n2. In the **Properties** panel, select the **SETUP** tab.\n3. Click the default **Location** field and replace it with the **City** dimension.\n4. Add metrics for bubble color and bubble size. For example, select **Sessions** for **Size** , and **Average time on Page** for **Color**.\n5. Select the **Style** tab.\n6. Use the sliders to adjust the background details, such as roads, landmarks, and labels.\n7. In the **Colors** section, select colors for the range of metric values.\n8. In the **Map Controls** section, turn on or off the map controls you want to let your viewers use.\n9. View your report. Pan, zoom, and scroll. You can also use [Street View](https://www.google.com/streetview/)!\n\nNext step\n---------\n\nCongratulations! You've created your first Looker Studio report!\n\nIf you'd like, add titles, change colors and styles, add more visualizations. When you're ready to move on, begin the next lesson: [View and share your report](/looker/docs/studio/tutorial-view-and-share-your-report).\n\nRelated resources\n-----------------\n\n[Types of charts in Looker Studio](/looker/docs/studio/types-of-charts-in-looker-studio)"]]