Conversational Analytics is a chat-with-your-data feature that is powered by Gemini for Google Cloud. Conversational Analytics empowers users with no expertise in business intelligence to go beyond static dashboards and ask data-related questions in regular, natural (conversational) language. Conversational Analytics is available in Looker (Google Cloud core), Looker (original) instances, and within Looker Studio as part of a Looker Studio Pro subscription.
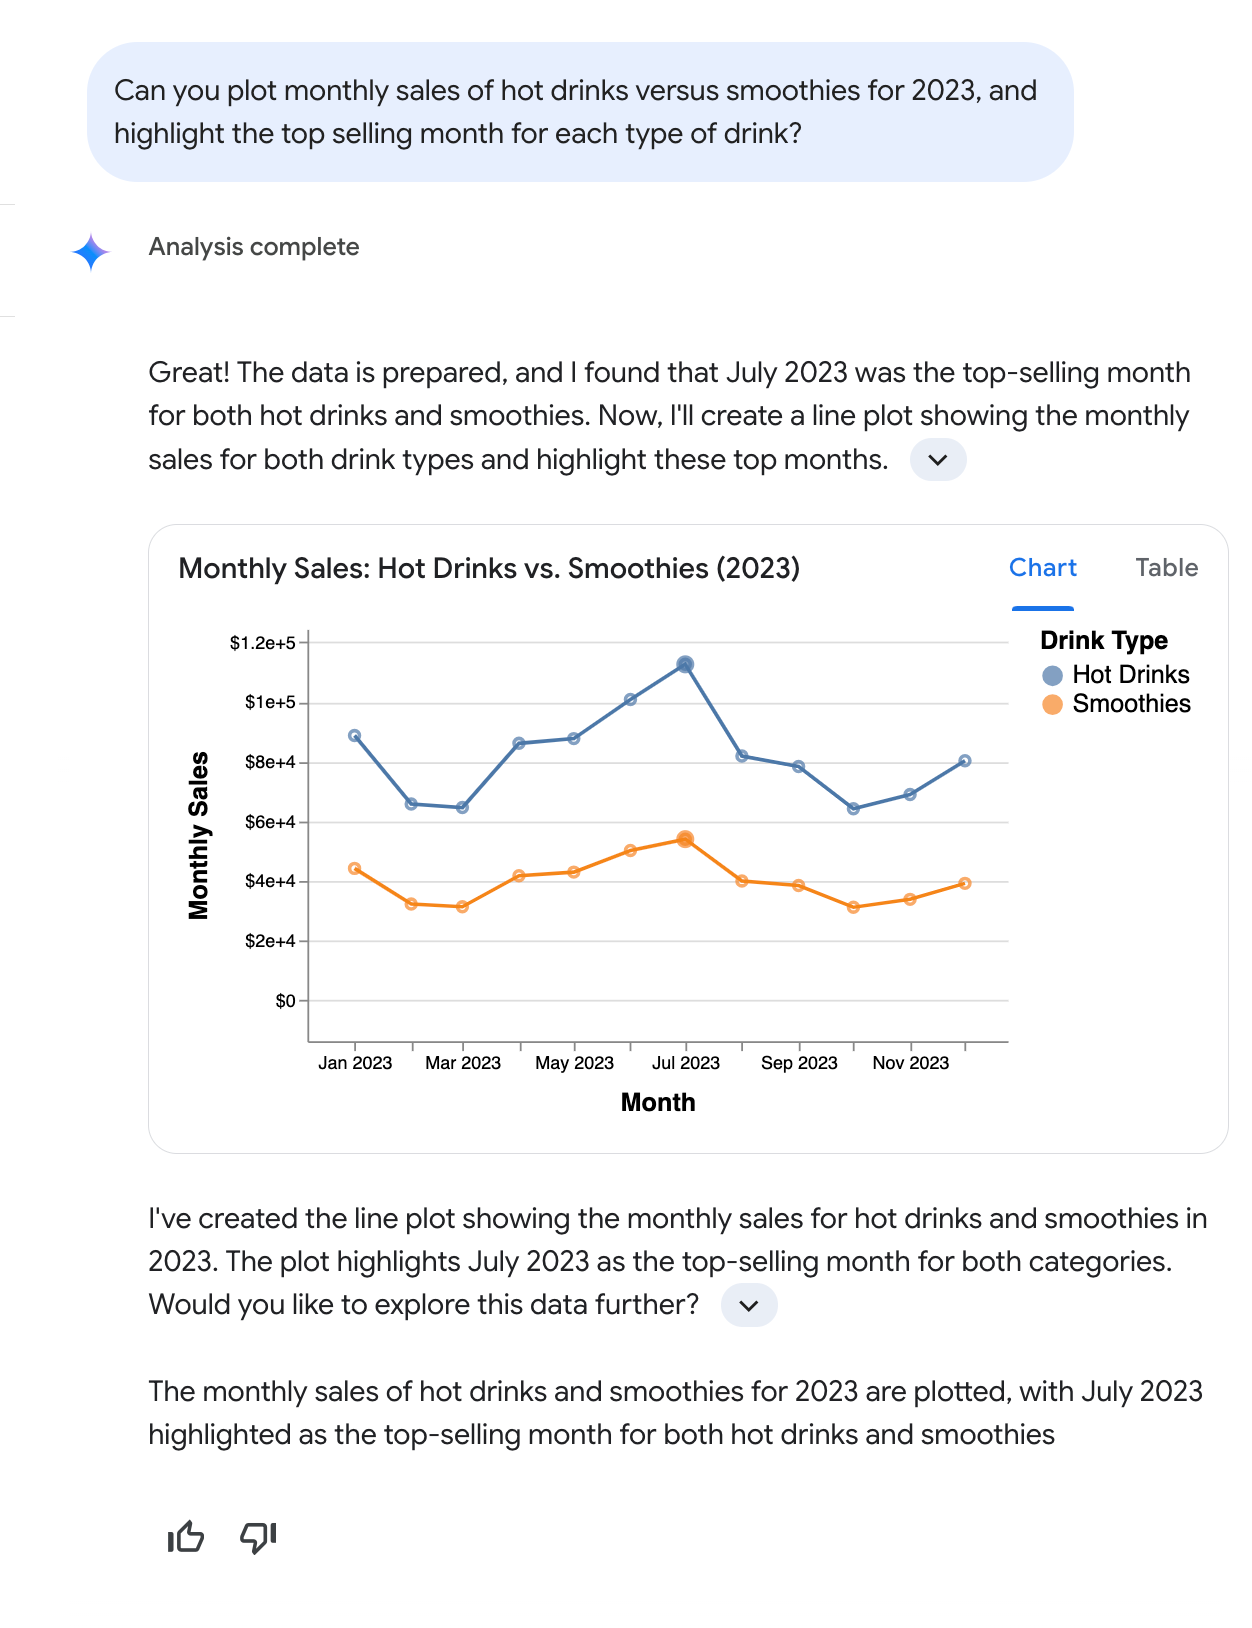
The following sample conversation shows how a user can interact with Conversational Analytics in a natural, back-and-forth way. In this example, the user asks the following question: "Can you plot monthly sales of hot drinks versus smoothies for 2023, and highlight the top selling month for each type of drink?" Conversational Analytics responds by generating a line graph that displays the monthly sales of hot drinks and smoothies for 2023, highlighting July as the month with the highest sales for both categories.
 s
s
As this sample conversation illustrates, Conversational Analytics interprets natural language requests, including multi-part questions that use common terms like "sales" and "hot drinks," without requiring users to specify exact database field names (like Total monthly drink sales) or define filter conditions (like type of beverage = hot). Conversational Analytics describes its key findings, explains its reasoning, and provides an answer that includes text and, where appropriate, a chart. To encourage deeper analysis, Conversational Analytics may also suggest follow-up questions.
Learn how and when Gemini for Google Cloud uses your data.
Key features
Conversational Analytics includes the following key features:
- Use Conversational Analytics in Looker: Access Conversational Analytics in Looker to ask natural language questions about your Looker Explore data within a Looker (original) instance or a Looker (Google Cloud core) instance.
- Use Conversational Analytics in Looker Studio: Access Conversational Analytics in Looker Studio to ask natural language questions about data from supported data sources. Requires a Looker Studio Pro subscription.
- Create and converse with data agents: With data agents, you can customize the AI-powered data querying agent by providing context and instructions that are specific to your data, which helps Conversational Analytics generate more accurate and contextually relevant responses.
- Enable advanced analytics with the Code Interpreter: The Code Interpreter within Conversational Analytics translates your natural language questions into Python code and executes that code. Compared to standard SQL-based queries, the Code Interpreter's use of Python enables more complex analysis and visualizations.
Setup and requirements
To use Conversational Analytics within a Looker instance, you and your Looker instance must meet the following requirements:
- Gemini in Looker must be enabled for the Looker instance.
- To access these features in a Looker (original) instance, a Looker admin must enable Gemini in Looker in the Looker (original) instance settings. The instance must be on Looker 25.2 or later and be Looker hosted. We recommend that customers participating in Lookers Extended support release program update to Looker 25.6 or later to use Conversational Analytics.
- To access these features in a Looker (Google Cloud core) instance, a user with the Looker Admin (
roles/looker.admin) IAM role must enable Gemini in Looker in the Looker (Google Cloud core) instance settings in the Google Cloud console.
- The Trusted Tester capabilities must be enabled to use Conversational Analytics during the preview period.
- A Looker admin must grant you a Looker role that contains the
gemini_in_lookerpermission for the models that you're querying. This permission is available as part of the default Gemini role. Additional permissions may be necessary to carry out the tasks that use Gemini assistance. You must also have a role that contains theaccess_datapermission for the model that you are querying.
To use Conversational Analytics in Looker Studio, you must meet the following requirements.
- You must be a user under a Looker Studio Pro subscription. Looker Studio Pro licenses are available at no cost to Looker users.
- An administrator must have enabled Gemini in Looker for Looker Studio.
- The Trusted Tester features must be enabled to use Conversational Analytics during the preview period.
Known limitations
Conversational Analytics has the following known limitations.
Limitations on visualizations
Conversational Analytics leverages Vega-lite for conversation chart generation. The following Vega chart types are fully supported:
- Line chart (one or more series)
- Area chart
- Bar chart (horizontal, vertical, stacked)
- Scatter plot (one or more groups)
- Pie chart
The following Vega chart types are supported, but you may encounter unexpected behavior when rendering them:
- Maps
- Heatmaps
- Charts with tooltips
Chart types that exist outside the Vega catalog are not supported. Any charts that are not specified in this section are considered unsupported.
Limitations on data sources
Conversational Analytics has the following data source limitations:
- For Looker data, Conversational Analytics can return a maximum of 5,000 rows per query.
- Conversational Analytics doesn't support BigQuery's Flexible Column Names feature.
- Conversational Analytics doesn't work well with data sources that have field editing in reports disabled because this setting prevents Conversational Analytics from creating calculated fields.
- When the data source is Looker, Conversational Analytics cannot set the value of a filter-only that is defined using the LookML
parameterparameter. - While Conversational Analytics generally supports connections to Looker (Google Cloud core) instances with private connections configurations, Conversational Analytics does not support Looker (Google Cloud core) instances that are configured to use CMEK or VPC Service Controls.
- Using Conversational Analytics to connect to a private connections Looker (Google Cloud core) instance using Looker Studio Pro when that Looker (Google Cloud core) instance is inside a VPC Service Controls perimeter is not a supported configuration and does not meet VPC Service Controls compliance requirements.
Limitations on questions
Conversational Analytics supports questions that can be answered by a single visualization, for example:
- Metric trends over time
- Breakdown or distribution of a metric by dimension
- Unique values for one or more dimensions
- Single metric values
- The top dimension values by metric
Conversational Analytics doesn't yet support questions that can only be answered with the following types of complicated visualizations:
- Prediction and forecasting
- Advanced statistical analysis, including correlation and anomaly detection
More advanced questions, such as forecasting, can be answered when the Code Interpreter is enabled.
Provide feedback
You can provide feedback to Google about individual responses in Conversational Analytics by selecting one of the following options:
- thumb_up Good response: Indicate that the response was helpful.
- thumb_down Bad response: Indicate that the response was not helpful.