例如,您可以混合使用来自不同 BigQuery 表的数据(例如客户信息和订单详情),并在单个 Looker Studio 表中直观呈现这些信息。再举一个例子,您可以将 Google Ads 账号和 Google Analytics 账号中的合并数据绘制到时序图上,以便从统一视图中查看营销广告系列的效果。
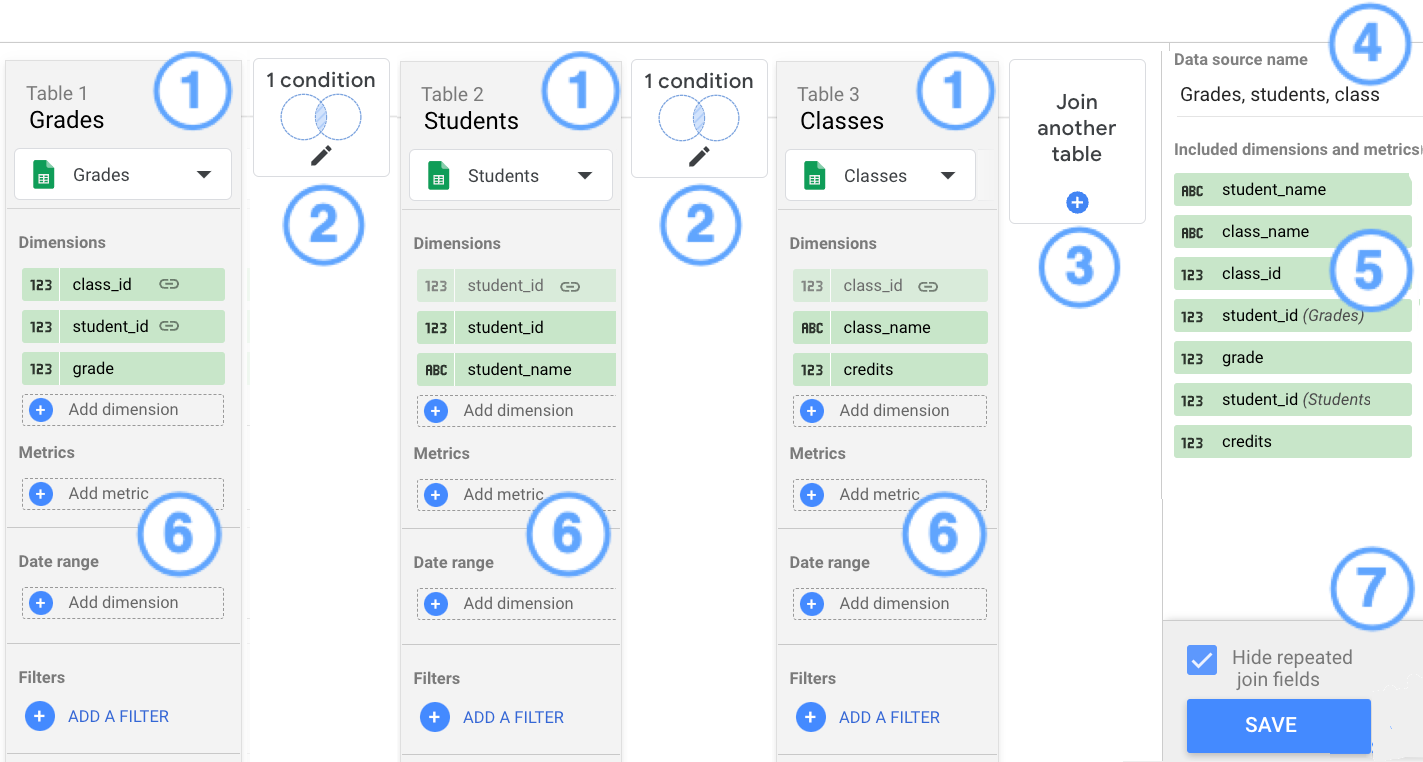
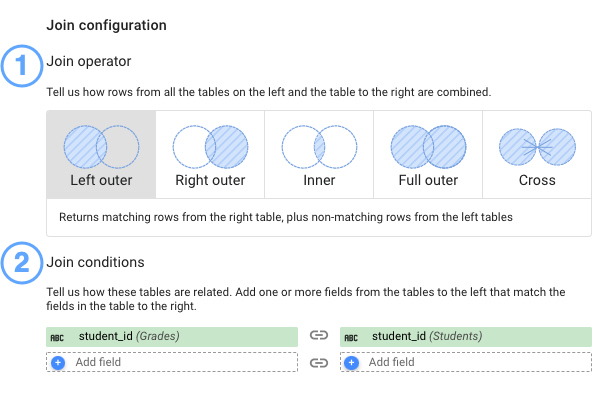
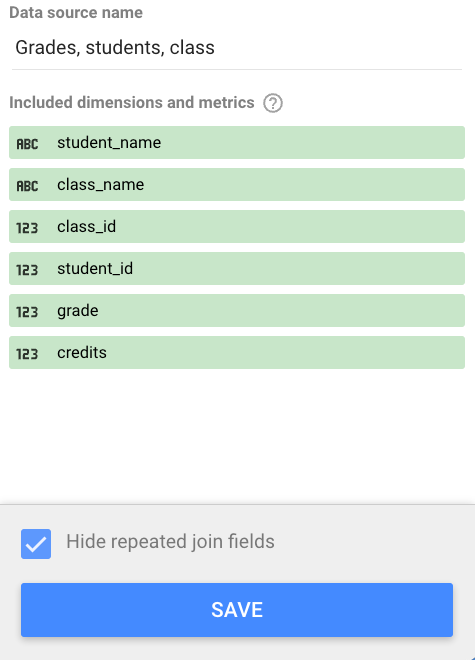
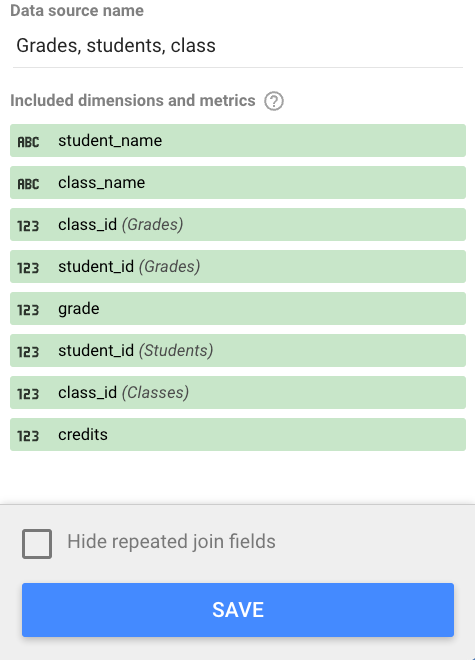
[[["易于理解","easyToUnderstand","thumb-up"],["解决了我的问题","solvedMyProblem","thumb-up"],["其他","otherUp","thumb-up"]],[["很难理解","hardToUnderstand","thumb-down"],["信息或示例代码不正确","incorrectInformationOrSampleCode","thumb-down"],["没有我需要的信息/示例","missingTheInformationSamplesINeed","thumb-down"],["翻译问题","translationIssue","thumb-down"],["其他","otherDown","thumb-down"]],["最后更新时间 (UTC):2025-08-25。"],[],[],null,["# How blends work in Looker Studio\n\nBlending data lets you create charts, tables, and controls that are based on multiple data sources. You can blend data from up to five data sources in Looker Studio or in [Looker reports](/looker/docs/glossary#reports).\n\nFor example, you can blend data from different BigQuery tables---say customer information and order details---and visualize that information in a single Looker Studio table. As another example, you can plot combined data from your Google Ads and Google Analytics accounts on a time series to see a unified view of your marketing campaign performance.\n| **Tip:** Blending data can be complex. To get the most from this page, you should be familiar with the following concepts:\n|\n| - [Creating and editing data sources](/looker/docs/studio/about-data-sources)\n| - [Dimensions, metrics, and data modeling](/looker/docs/studio/model-your-data)\n\nDifferences between blends and data sources\n-------------------------------------------\n\nBlending data creates a resource known as a *blend*. Blends are similar to data sources, in that they provide data for charts and controls in your report. However, blends differ from data sources in some important ways:\n\n- Blends get their information from multiple data sources.\n- Blends are always embedded into the report in which they are created. You can't make a blend reusable across reports. However, if you copy the report, the blends are copied into the new report, so your charts will continue to work on the blended data.\n- Metrics in the underlying data source become unaggregated numeric dimensions in the blend. See the [Blending tips and advanced concepts](/looker/docs/studio/blending-tips-and-advanced-concepts) documentation page for more information.\n- Blends have no data freshness or credentials settings of their own. Instead, these settings are inherited from the underlying data sources.\n\nHow blends work\n---------------\n\nDatabase programmers use SQL join statements to blend data from different tables. In Looker Studio, you can blend data without writing code. Instead, you use the blend editor to configure the join, as shown in the following screenshot:\n\nLegend:\n\n1. Tables\n2. Join configuration\n3. **Join another table** button\n4. Blend name\n5. Included dimensions and metrics\n6. Add metrics, date range, and filters\n7. **Hide repeated join fields** option and **SAVE** button\n\n### Tables\n\nBlends are made up of *tables*. When you edit or create a blend, you'll see its tables displayed in the UI. Each table contains a set of fields that are extracted from the underlying data source. A blend can have up to five tables.\n\nTo add data to a table, click **Add dimension** or **Add metric**.\n\nFields used in join conditions are shown with a link icon .\n\n### Join configuration\n\nA *join configuration* links pairs of tables in a blend. A join configuration consists of an *operator* , which defines how to combine matching and non-matching records from those tables, and a *condition*, which is a set of fields that defines how the tables are related to each other.\n\nFor example, in the following screenshot, the **Grades** table joins to the **Students** table on the `student_id` field and to the **Classes** table on the `class_id` field. Both join configurations use the left outer operator.\n\n### Join operators\n\nThe join operator determines how the matching and non-matching rows from the tables in the blend are joined together. Looker Studio supports the following join operators:\n\n- **Inner join**: Returns only matching rows from the left and right tables.\n- **Left outer join**: Returns matching rows from the right table, plus non-matching rows from the left tables.\n- **Right outer join**: Returns matching rows from the left tables, plus non-matching rows from the right table.\n- **Full outer join**: Returns all matching rows from the left tables or the right table.\n- **Cross join**: Returns every possible combination of rows from the left and right tables.\n\nLearn more about join operators in the [BigQuery documentation](/bigquery/docs/reference/standard-sql/query-syntax#join_types).\n\n### Join conditions\n\nA join condition is a field or fields that can be found in each table and can be used to link the records of those tables together. For example, in a blend of Google Analytics and Google Ads charts, if **Campaign Name** exists in both of the extracted tables, Looker Studio can use that field to join the data.\n\nFor each table in the blend, you'll select which fields to use in the condition. Note that you don't have to use the same fields for every table, nor do the fields have to have the same names, as long as the data in each field is the same. For example, say you want to visualize customers, orders, and items in a single chart. These tables might have the following fields:\n\n**Customers** table\n\n- `customer_ID`\n- `customer_name`\n\n**Orders** table\n\n- `cust_id`\n- `order_number`\n- `order_total`\n\n**Items** table\n\n- `order_number`\n- `SKU`\n\nTo blend these tables, you'd join the **Customers** table with the **Orders** table, using the `customer_ID` and `cust_id` fields as the join condition, and you'd join the **Orders** table with the **Items** table using `order_number` as the join condition.\n| **Note:** Looker Studio only supports equality between the fields in the join condition. For example, you can create a join condition for Field A = Field B, but not Field A ≠ Field B, Field A \\\u003e Field B, or Field A \\\u003c Field B.\n\nIncluded dimensions and metrics\n-------------------------------\n\nAny field that is used in the join conditions of the blend, plus any additional dimensions or metrics that you add to the blend, are listed in the **Included dimensions and metrics** section. These are the fields that you'll be able to use in any charts that is based on the blend.\n\n### Hide repeated join fields\n\nThe **Hide repeated join fields** option excludes duplicated fields that are used in join conditions. To include repeated join fields, clear this option.\n\nFor example, say you are joining three tables: **Grades** , **Students** , and **Classes** , using `student_id` and `class_id` fields in the join configuration. With the **Hide repeated join fields** option selected, the blend includes only one instance of `student_id` and `class_id`.\n\nFor the same blend configuration, with the **Hide repeated join fields** option cleared, the blend now includes multiple instances of`student_id` and `class_id`, along with the name of the table in which that field appears, for example, `class_id` (Grades), `class_id` (Classes), `student_id` (Grades), and `student_id` (Students).\n\nDate ranges and filters\n-----------------------\n\nYou can limit the data in the blend by [applying a date range or filter](/looker/docs/studio/blending-tips-and-advanced-concepts) to one or more tables.\n\nBlending example\n----------------\n\nThe [classes, students, and grades blending example](/looker/docs/studio/blending-example-classes-students-and-grades) demonstrates how to solve a classic data blending use case."]]