假设您是一名学校管理员,需要存储有关所提供课程、注册这些课程的学生以及他们在每门课程中获得的成绩的信息。您可以使用 Looker Studio 通过数据混合功能来跟踪和直观呈现此类信息。
要回答的问题
以下示例回答了您可能对数据有以下疑问:
- 哪些学生选修了哪些课程,每位学生在每门课程的成绩是多少?
- 每门课程的最高成绩是多少?
- 哪些学生在每门课程中获得的成绩最高?
样本数据
以下是示例中使用的数据。
课程:
| class_id |
class_name |
|---|---|
| c1 |
水下编篮 |
| c2 |
轻松实现住宅融合 |
| c3 |
如何训练攻击鬣蜥 |
| c4 |
边学边玩,轻松掌握 SQL |
学生:
| student_id |
student_name |
|---|---|
| s1 |
Brett |
| s2 |
Rick |
| s3 |
Susanna |
| s4 |
Jennifer |
成绩:
| student_id |
class_id |
成绩 |
|---|---|---|
| s1 |
c1 |
2 |
| s2 |
c1 |
99 |
| s3 |
c1 |
65 |
| s4 |
c1 |
3 |
| s2 |
c2 |
38 |
| s3 |
c2 |
88 |
| s4 |
c2 |
48 |
| s1 |
c3 |
7 |
| s4 |
c3 |
32 |
| s1 |
c4 |
94 |
| s2 |
c4 |
63 |
| s3 |
c4 |
75 |
| s4 |
c4 |
20 |
设置
第一步是在 Looker 数据洞察中创建数据源,以连接到您的数据。演示报告使用 Google 表格存储基础数据,但您也可以将这些数据存储在数据库(例如 BigQuery 或 MySQL)中。
- 创建新报告。
- 添加与示例数据对应的 3 个数据源:
- 类
- 学生
- 成绩
了解如何创建和修改数据源。
问题 1:收到的学生、课程和成绩
问题:“哪些学生选修了哪些课程,每位学生在每门课程的成绩是多少?”
如需回答此问题,请按以下步骤操作:
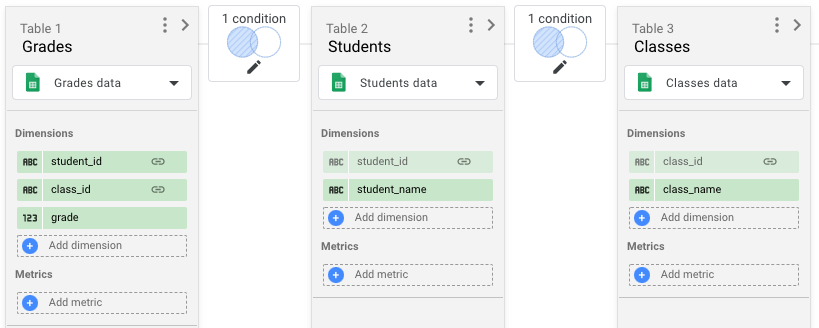
- 创建新的混合。
- 添加一个成绩表格,其中包含以下维度:
student_idclass_idgrade
- 添加一个学生表,其中包含以下维度:
student_idstudent_name
- 添加一个包含以下维度的课程表格:
class_idclass_name
- 使用
student_id将成绩与学生联接起来。 - 使用
class_id将成绩与课程联接起来。 - 将这两个联接操作都设置为左外联接。

- 保存混合并关闭编辑器。
- 在报告中添加一个包含
student_name、class_name和grade字段的表格。 - 按
student_name降序对表格进行排序。
您的表格应如下所示:
| student_name | class_name | 成绩 |
|---|---|---|
| Brett | 水下编篮 | 2 |
| Brett | 如何训练攻击性鬣蜥 | 7 |
| Brett | 边学边玩,轻松掌握 SQL | 94 |
| Jennifer | 水下编篮 | 3 |
| Jennifer | 轻松实现住宅融合 | 48 |
| Jennifer | 如何训练攻击性鬣蜥 | 32 |
| Jennifer | 边学边玩,轻松掌握 SQL | 20 |
| Rick | 水下编篮 | 99 |
| Rick | 轻松实现住宅融合 | 38 |
| Rick | 边学边玩,轻松掌握 SQL | 63 |
| Susanna | 水下编篮 | 65 |
| Susanna | 轻松实现住宅融合 | 88 |
| Susanna | 边学边玩,轻松掌握 SQL | 75 |
问题 2:按课程显示最高成绩
问题:“每个课程的最高成绩是多少?”
如需回答此问题,请按以下步骤操作:
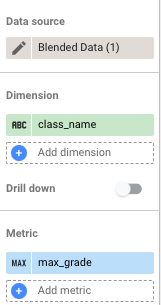
- 使用与问题 1 中相同的混合模式。
- 向报告中添加表格。
- 将
class_name添加为维度,将grade添加为指标。 - 修改
grade字段,如下所示:- 将名称更改为
max_grade。 - 将汇总设置为 MAX。
- 将名称更改为
按
max_grade降序对表格进行排序。
您的表格应如下所示:
| class_name | max_grade |
|---|---|
| 水下编篮 | 99 |
| 边学边玩,轻松掌握 SQL | 94 |
| 如何训练攻击性鬣蜥 | 32 |
| 轻松实现住宅融合 | 88 |
问题 3:按课程和学生显示最高成绩
问题:“每门课程的最高成绩是哪位学生获得的?”
如需回答此问题,请按以下步骤操作:
- 创建新的混合。
- 添加一个包含以下维度的课程表格:
class_idclass_name
- 添加一个成绩表,将其命名为成绩 1,然后添加维度
class_id。 - 将
grade添加为指标,并将汇总设置为 MAX。 - 将
grade重命名为max_grade。 - 再次添加成绩表格,将其命名为成绩 2,然后添加维度:
student_idclass_idgrade
- 添加一个学生表,其中包含以下维度:
student_idstudent_name
- 对每个联接使用左外联接。
- 使用
class_id将课程与成绩联接起来。 - 使用以下代码将成绩与成绩 2 联接起来:
class_id = class_idmax_grade = grade
使用
student_id将“成绩 2” 与“学生” 联接起来。
保存混合并关闭编辑器。
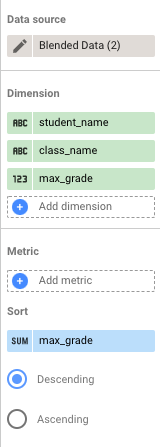
在报告中添加一个包含
student_name、class_name和max_grade字段的表格。
您的表格应如下所示:
| student_name | class_name | max_grade |
|---|---|---|
| Rick | 水下编篮 | 99 |
| Brett | 边学边玩,轻松掌握 SQL | 94 |
| Susanna | 轻松实现住宅融合 | 88 |
| Jennifer | 如何训练攻击性鬣蜥 | 32 |

