本頁內容適用於 Apigee 和 Apigee Hybrid。
查看
Apigee Edge 說明文件。

這個資訊主頁會顯示哪些資訊?
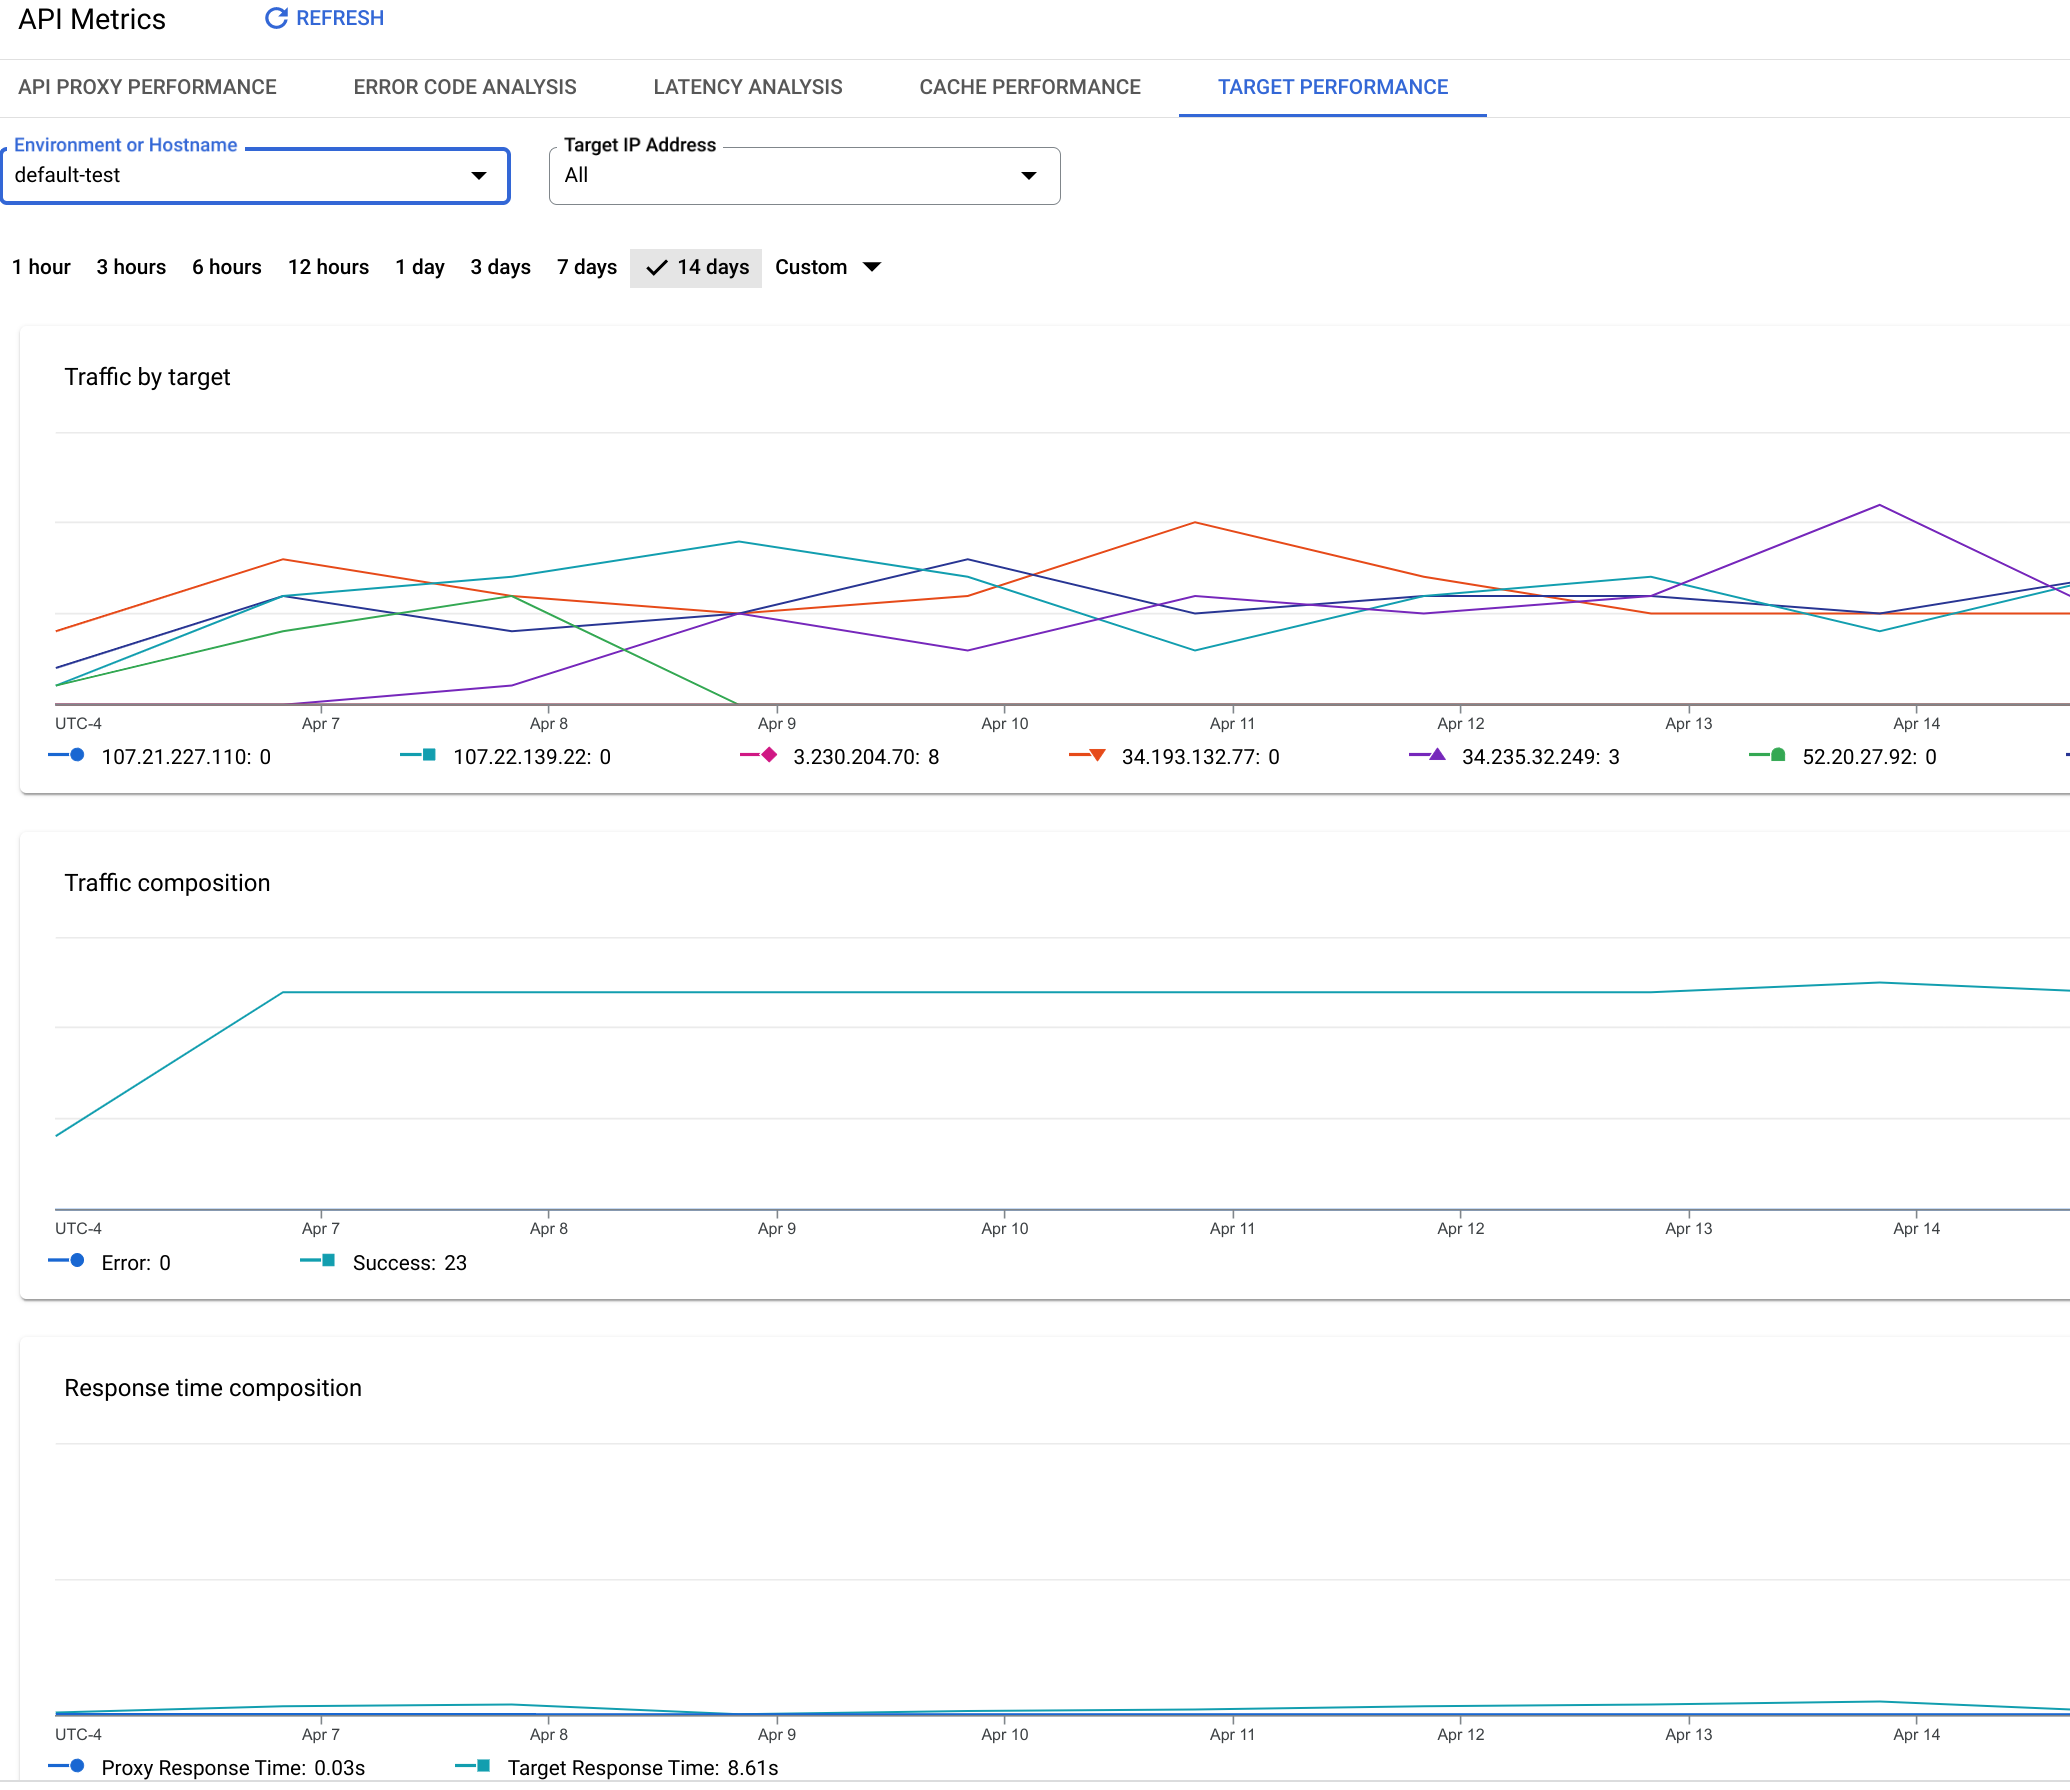
「目標成效」資訊主頁可協助您以視覺化方式呈現 API Proxy 後端目標的流量模式和成效指標。
目標成效資訊主頁
如要存取目標成效資訊主頁:
在 Google Cloud 控制台中,依序前往「Analytics」(分析) >「API metrics」(API 指標) >「Target Performance」(目標成效) 頁面。
系統會顯示「目標成效」檢視畫面:
這個資訊主頁會評估哪些資料?
依目標區分的流量
| 指標 | 說明 |
|---|---|
| 所有目標流量 | 評估從 Apigee 傳送至所有後端目標的流量總量。 |
| <目標名稱> |
評估從 Apigee 傳遞至指定後端目標的流量總量。 |
流量
| 指標 | 說明 |
|---|---|
| 總流量 | 評估從 Apigee 傳送至所有後端目標的流量總量。與「所有目標流量」相同。 |
| 錯誤 | 傳送至後端目標的要求總數,但回應失敗。錯誤回應不會計入。 |
| 成功 | 成功傳送至後端目標的所有要求總數 (未傳回錯誤)。 |
回應時間
另請參閱 Apigee 社群網站上的這篇有趣文章: 平均總回應時間何時會低於平均目標回應時間?
| 指標 | 說明 |
|---|---|
| 平均時間 |
針對向 Apigee 機構環境發出的所有 API 呼叫,測得的「總回應時間」平均值。總回應時間是指 API 呼叫傳回 Apigee 的時間長度 (以毫秒為單位)。 換句話說,總回應時間是指從 Apigee 收到完整 API 呼叫,到 Apigee 開始將回應傳回用戶端應用程式所測量的時間。 |
| 平均目標時間 |
從 Apigee 將要求的最後一個位元組傳送至後端目標,到 Apigee 接收回應的最後一個位元組,這段時間的平均毫秒數。 這項指標基本上是測量 API 呼叫在目標系統上花費的時間。 |
| 平均 Proxy 時間 |
計算方式為「總回覆時間」減去「目標回覆時間」。 這項指標基本上是衡量 API 呼叫在 Apigee 本身流動所花費的時間 (以毫秒為單位)。 |
目標錯誤
| 指標 | 說明 |
|---|---|
| 錯誤總數 | 評估從後端目標傳送至 Apigee 的錯誤總數。 |
| 3XX 錯誤 | 評估從後端目標傳送至 Apigee 的 HTTP 3XX 總數。 |
| 4XX 錯誤 | 測量從後端目標傳送至 Apigee 的 HTTP 4XX 錯誤總數。 |
| 5XX 錯誤 | 評估從後端目標傳送至 Apigee 的 HTTP 5XX 總數。 |
酬載大小
| 指標 | 說明 |
|---|---|
| 酬載總大小 | Apigee 與後端目標之間所有要求和回應的酬載大小總計。 |
| 要求酬載大小 | 從 Apigee 傳送至後端目標的所有要求酬載大小總計。 |
| 回應酬載大小 | 後端目標傳送至 Apigee 的所有回應酬載大小總計。 |