快取效能資訊主頁
本頁內容適用於 Apigee 和 Apigee Hybrid。
查看
Apigee Edge 說明文件。

這個資訊主頁會顯示哪些資訊?
快取效能資訊主頁會收集 ResponseCache 政策的資料。這個資訊主頁不會收集 LookupCache 或 PopulateCache 政策的資料。
您可以在「快取成效」資訊主頁中,一目瞭然地查看回應快取的值。
這個資訊主頁會以視覺化方式呈現回應快取的好處,例如縮短延遲時間和減少後端伺服器負載。
如要存取「快取效能」資訊主頁:
在 Google Cloud 控制台中,依序前往「Analytics」(分析) >「API metrics」(API 指標) >「Cache Performance」(快取效能) 頁面。
前往「快取效能」
系統會顯示「快取效能」檢視畫面:
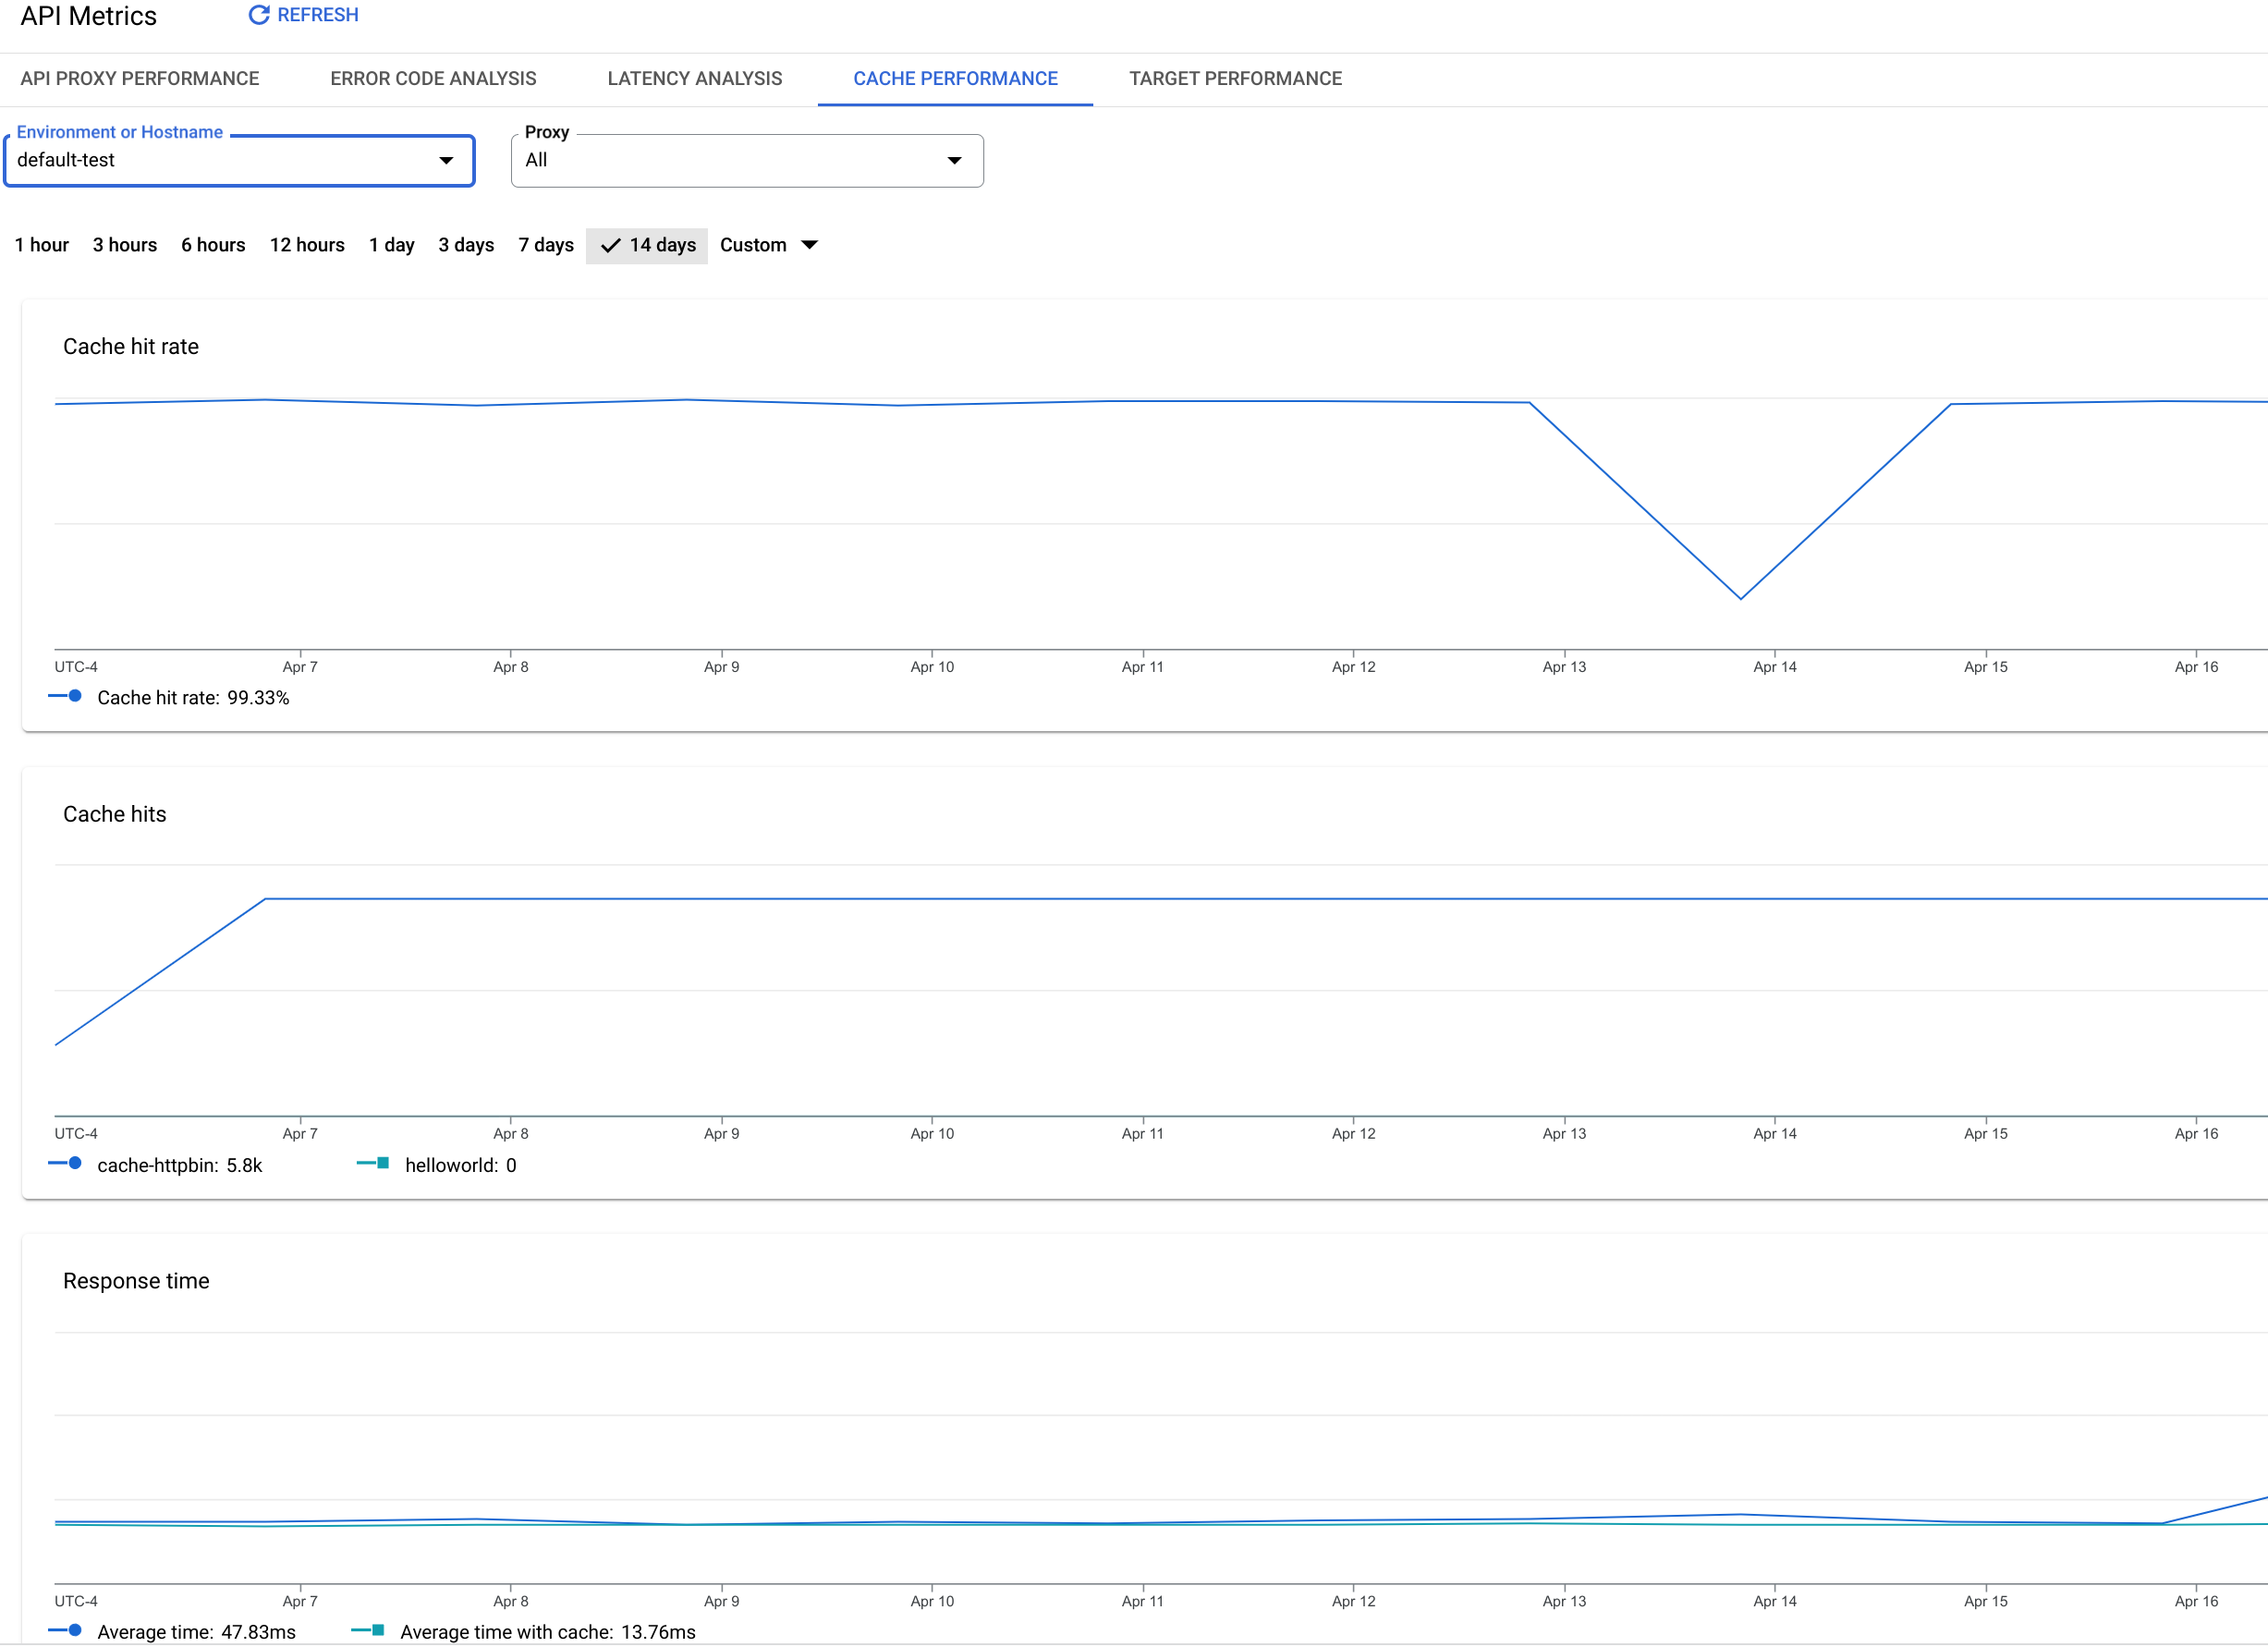
這個資訊主頁會評估哪些資料?
| 指標 |
說明 |
| 平均快取命中率 |
相較於 API 總流量,命中快取的呼叫比率。 |
| API Proxy 的快取命中次數 |
命中快取的呼叫總數,依 API Proxy 細分。
|
| 平均快取時間 |
API 呼叫命中快取時的平均時間。 |
| 不含快取的平均時間 |
API 呼叫未命中快取時的平均時間。 |
除非另有註明,否則本頁面中的內容是採用創用 CC 姓名標示 4.0 授權,程式碼範例則為阿帕契 2.0 授權。詳情請參閱《Google Developers 網站政策》。Java 是 Oracle 和/或其關聯企業的註冊商標。
上次更新時間:2025-10-19 (世界標準時間)。
[[["容易理解","easyToUnderstand","thumb-up"],["確實解決了我的問題","solvedMyProblem","thumb-up"],["其他","otherUp","thumb-up"]],[["難以理解","hardToUnderstand","thumb-down"],["資訊或程式碼範例有誤","incorrectInformationOrSampleCode","thumb-down"],["缺少我需要的資訊/範例","missingTheInformationSamplesINeed","thumb-down"],["翻譯問題","translationIssue","thumb-down"],["其他","otherDown","thumb-down"]],["上次更新時間:2025-10-19 (世界標準時間)。"],[],[]]