이 페이지는 Apigee 및 Apigee Hybrid에 적용됩니다.
Apigee Edge 문서 보기

API 모니터링 타임라인 뷰에는 문제를 진단하고 조사하는 데 도움이 되도록 최근 API 트래픽의 타임라인이 표시됩니다.
타임라인 보기에 액세스하려면 API 모니터링 액세스의 단계를 따르고 타임라인을 선택합니다.
아래 그림은 타임라인이 선택된 UI를 보여줍니다.
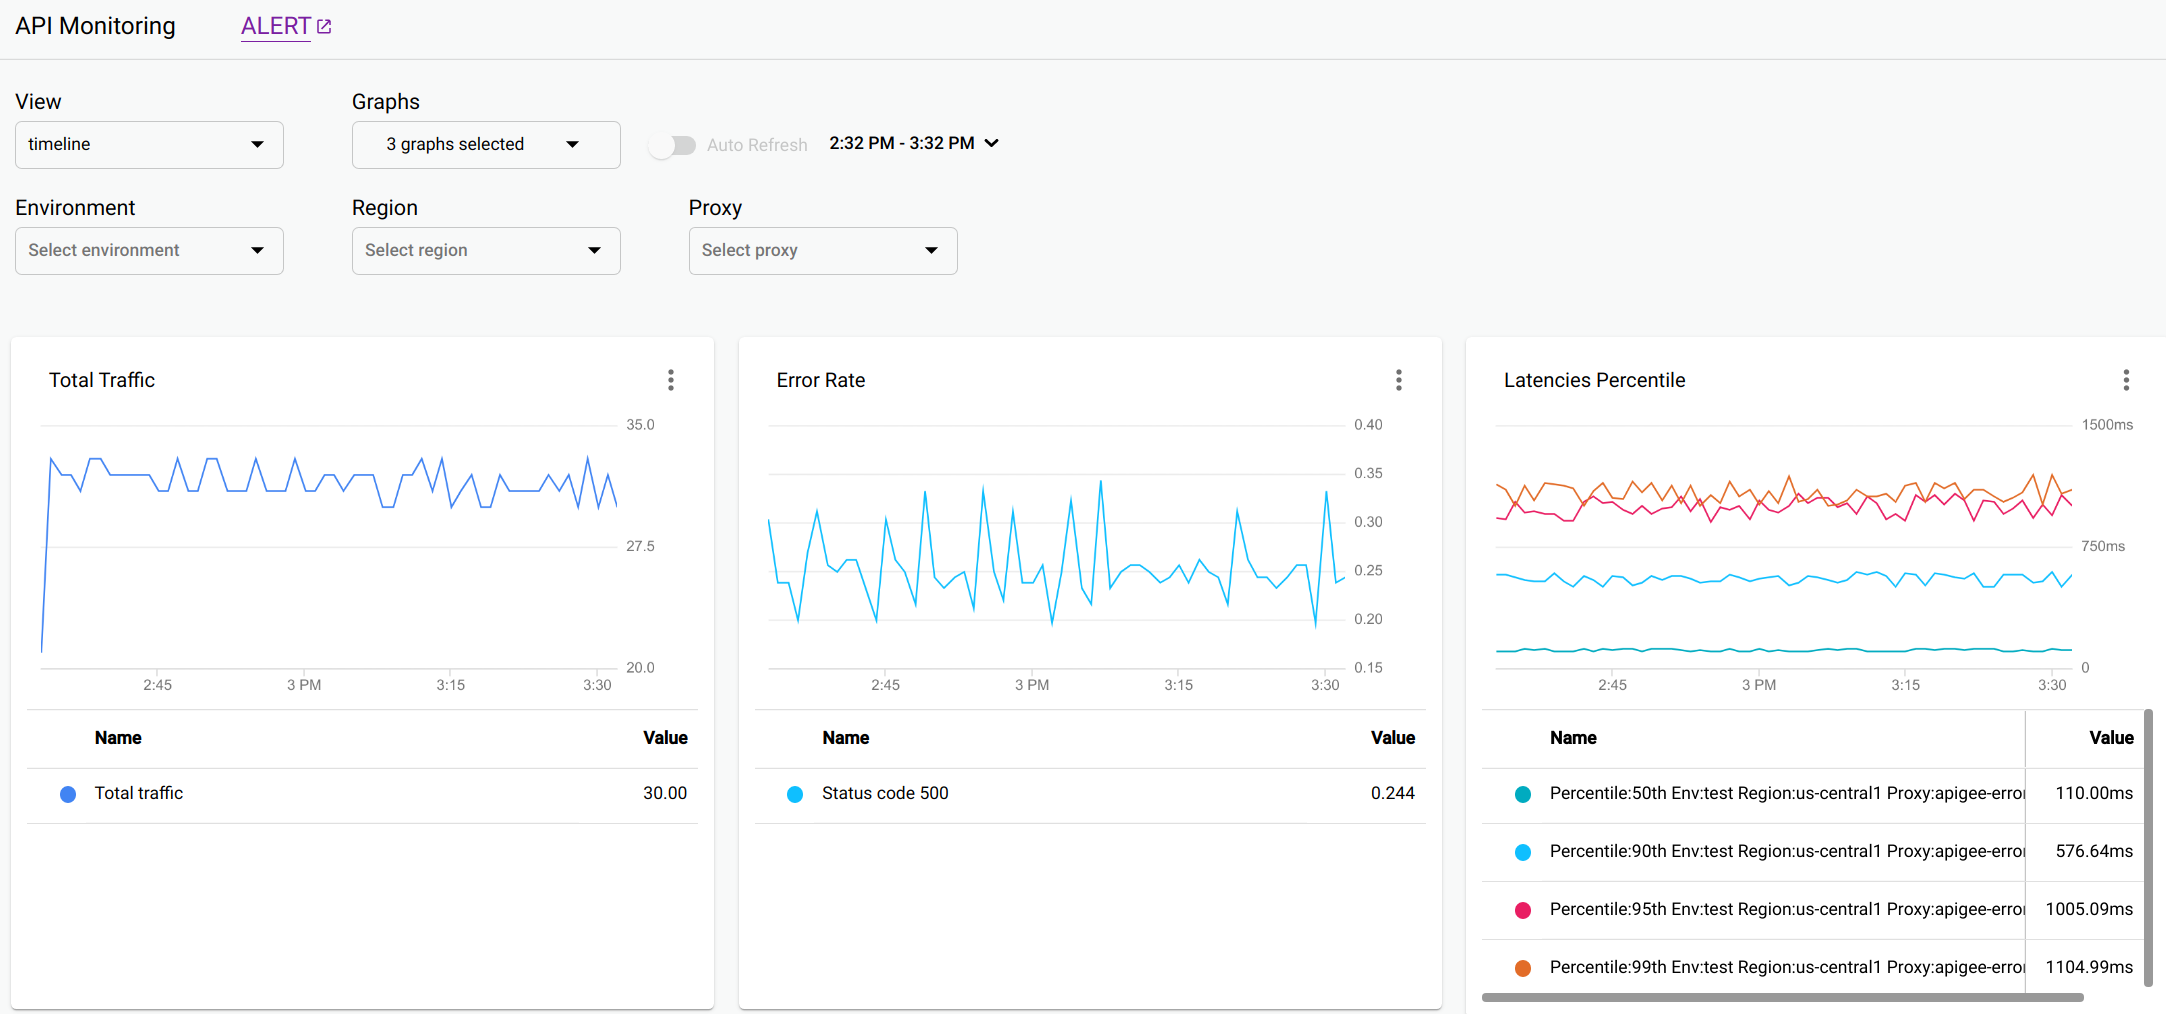
타임라인 뷰에는 다음 그래프가 표시됩니다.
- 총 Proxy 트래픽: 시간 범위의 1분 간격에 해당하는 요청 수
- Proxy 오류율: 총 오류(4xx 및 5xx)를 각 간격의 총 트래픽으로 나눈 값
- Proxy 지연 시간 백분위수: API 지연 시간의 백분위수. 이 그래프에서는 50번째(중간), 90번째, 95번째, 99번째 백분위수를 표시합니다.
- 타겟 총 트래픽
- 타겟 오류율
- 대상 지연 시간 백분위수
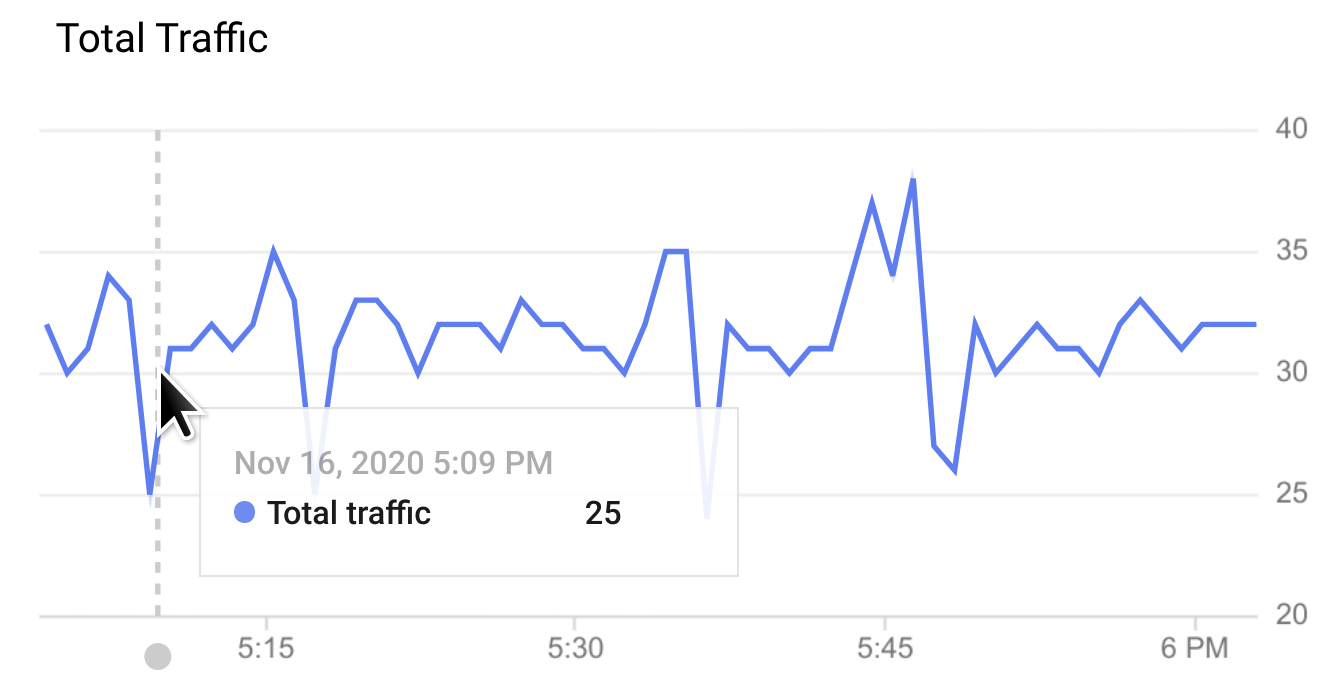
그래프의 특정 지점 위로 마우스를 가져가면 해당 시점에 값이 표시됩니다.
그래프 드롭다운 메뉴에서 표시할 그래프를 선택할 수 있습니다.
모든 뷰의 그래프 옵션
다음 그래프 옵션을 세 가지 뷰(타임라인, 조사, 최근)에서 사용할 수 있습니다.
- 경고: 경고를 클릭하여 트래픽 급증 또는 지연 시간과 같은 이벤트의 경고 및 알림을 설정합니다.
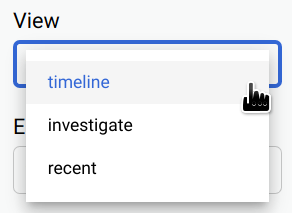
뷰: API 모니터링 뷰 중 하나를 선택합니다.
- 타임라인(위에 표시됨)
- 조사
- 최근
그래프: 드롭다운 목록에서 표시할 그래프를 선택합니다.
그래프를 선택하면 그래프가 가장 최근에 선택한 그래프부터 선택한 순서대로 표시됩니다.
기간: 그래프의 시간 범위를 선택합니다.
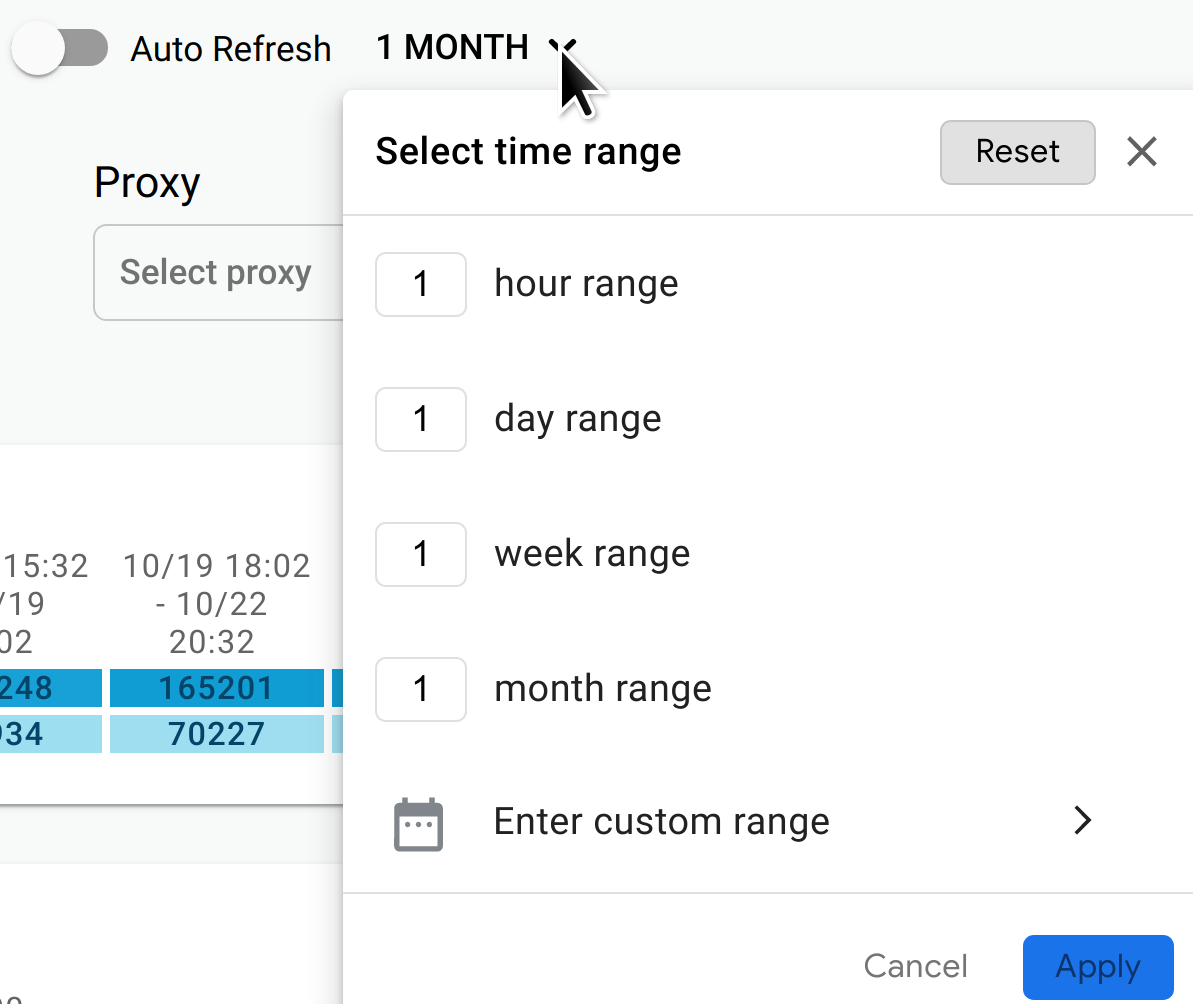
또한 자동 새로고침을 사용 설정하여 1분마다 한 번씩 데이터를 자동으로 새로고침할 수 있습니다.
환경: API의 환경을 선택합니다.
리전(타임라인 및 조사 뷰만): API 리전을 선택합니다.
프록시(타임라인 및 조사 뷰만): API 프록시를 선택합니다.