本页介绍了如何查看与 Ray 集群关联的跟踪日志,以及如何监控 Ray on Vertex AI 指标。此外,我们还提供了有关调试 Ray 集群的指导。
查看日志
使用 Vertex AI 上的 Ray 集群执行任务时,系统会自动生成跟踪日志并将其存储在 Cloud Logging 和开源 Ray 信息中心中。本部分介绍如何通过 Google Cloud 控制台访问生成的日志。
在开始之前,请务必阅读 Ray on Vertex AI 概览并设置您需要的所有必要工具。Ray OSS 信息中心
您可以通过 Ray OSS 信息中心查看开源 Ray 日志文件:
在 Google Cloud 控制台中,前往“Ray on Vertex AI”页面。
在您创建的集群对应的行中,选择 更多操作菜单。
选择 Ray OSS 信息中心链接。该信息中心会在另一个标签页中打开。
前往菜单右上角的日志视图:
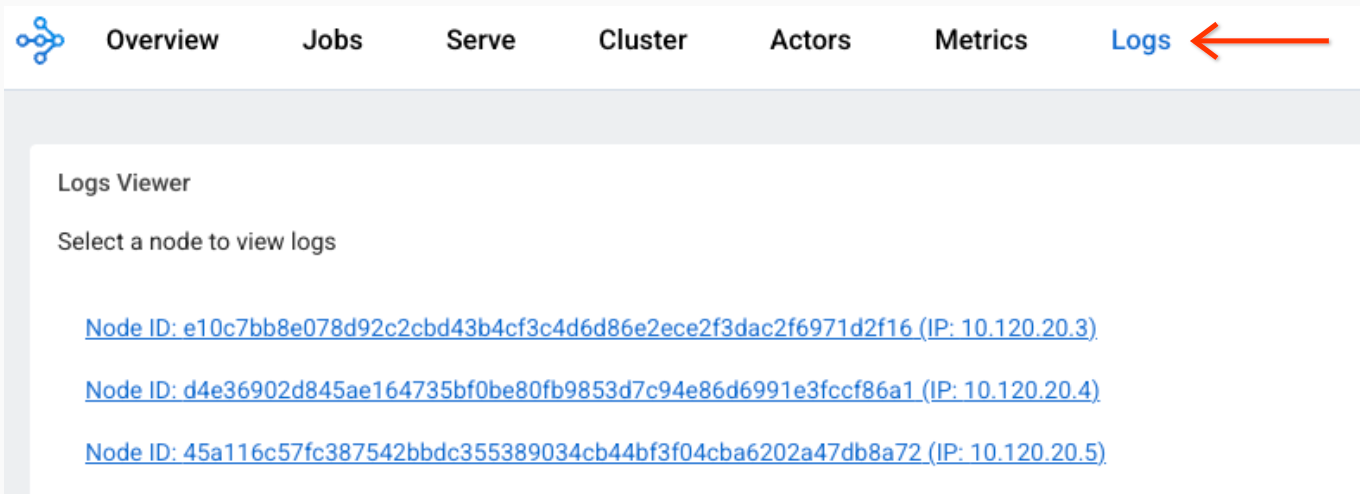
点击每个节点,查看与该节点关联的日志文件。
Cloud Logging 控制台
-
在 Google Cloud 控制台中,转到 Logs Explorer 页面:
如果您使用搜索栏查找此页面,请选择子标题为 Logging 的结果。
选择现有的 Google Cloud 项目、文件夹或组织。
如需显示所有 Ray 日志,请在查询编辑器字段中输入以下查询,然后点击运行查询:
resource.labels.task_name="ray-cluster-logs"
如需将日志范围缩小到特定的 Ray 集群,请将下面这行代码添加到查询中,然后点击运行查询:
labels."ml.googleapis.com/ray_cluster_id"=CLUSTER_NAME
将 CLUSTER_NAME 替换为您的 Ray 集群的名称。在 Google Cloud 控制台中,前往 Vertex AI > Ray on Vertex AI,您会看到每个区域的集群名称列表。
如需进一步缩小日志范围,以仅显示特定日志文件(如
raylet.out),请点击日志字段 -> 日志名称下的日志名称。您可以将类似的日志条目分为一组:
在查询结果中,点击一个日志条目以展开该日志。
在
jsonPayload中,点击tailed_path值。系统随即会显示一个下拉菜单。点击显示匹配的条目。
停用日志
默认情况下,Ray on Vertex AI Cloud Logging 处于启用状态。
如需停用将 Ray 日志导出到 Cloud Logging 的功能,请使用以下 Vertex AI SDK for Python 命令:
vertex_ray.create_ray_cluster(..., enable_logging=False, ...)
即使停用了 Ray on Vertex AI Cloud Logging 功能,您也可以在 Ray 信息中心查看 Ray 日志文件。
监控指标
您可以使用Google Cloud Monitoring (GCM) 以不同的方式查看 Ray on Vertex AI 指标。或者,您也可以将 GCM 中的指标导出到您自己的 Grafana 服务器。
监控 GCM 中的指标
您可以通过以下两种方式在 GCM 中查看 Ray on Vertex AI 指标。
- 使用 Metrics Explorer 下的直接视图。
导入 Grafana 信息中心。
Metrics Explorer
如需在 Metrics Explorer 下使用直接视图,请按以下步骤操作:
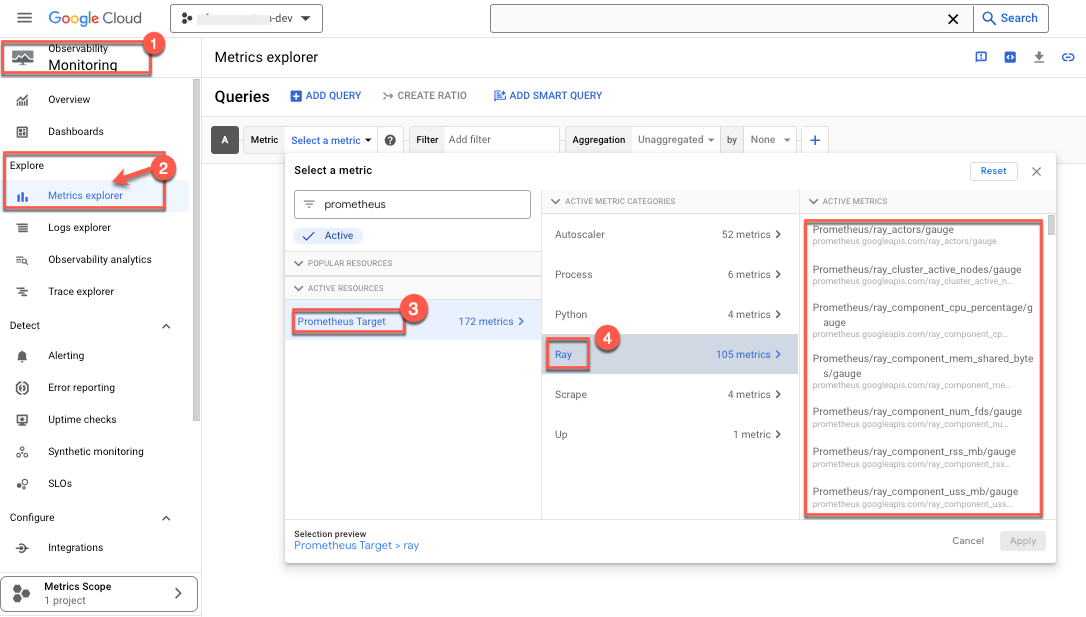
- 前往 Google Cloud Monitoring 控制台。
- 在探索下,选择 Metrics Explorer。
- 在活跃资源下,选择 Prometheus 目标。随即会显示活跃指标类别。
选择 Ray。
系统会显示一列指标:
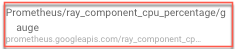
- 选择要监控的指标。例如:
- 选择 CPU 利用率百分比作为受监控的指标:
- 选择过滤条件。例如,选择集群:
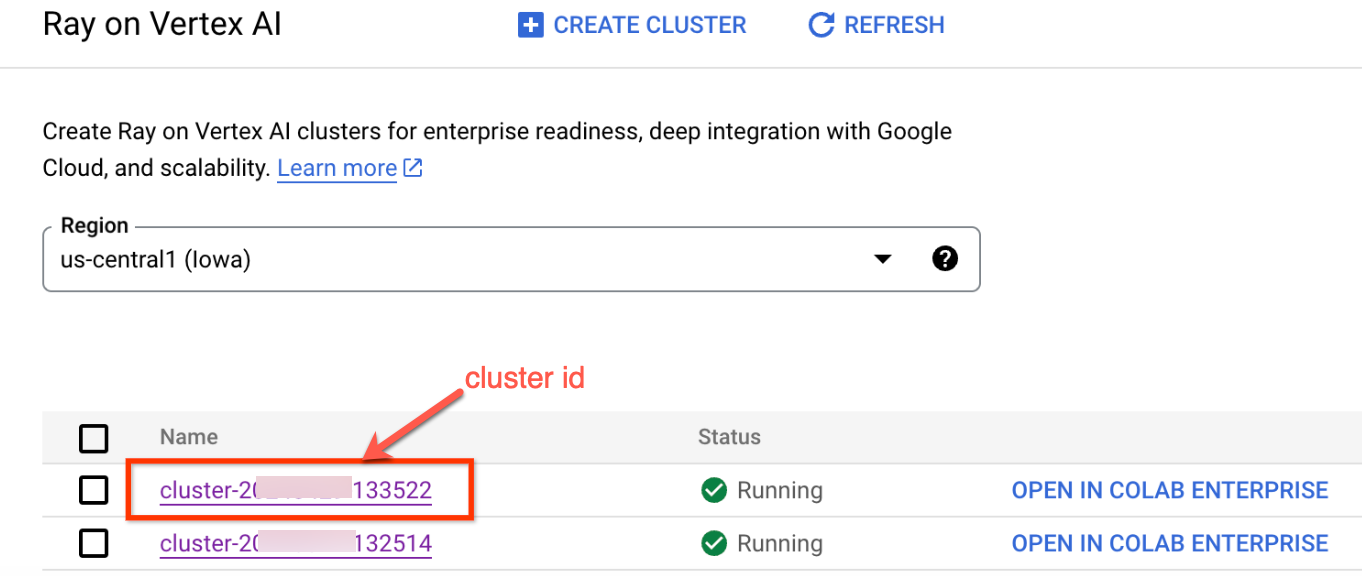
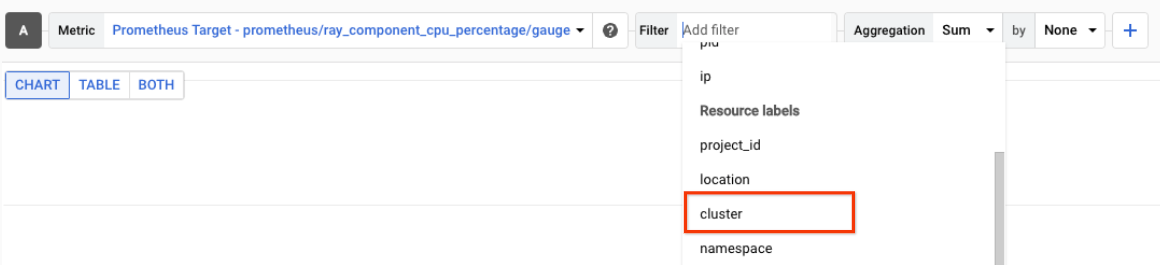 使用集群 ID 仅监控特定集群的上述指标。如需查找集群 ID,请按以下步骤操作:
在 Google Cloud 控制台中,前往 Ray 页面。
- 确保您位于要在其中创建实验的项目。

- 在名称下方,会显示一个集群 ID 列表。
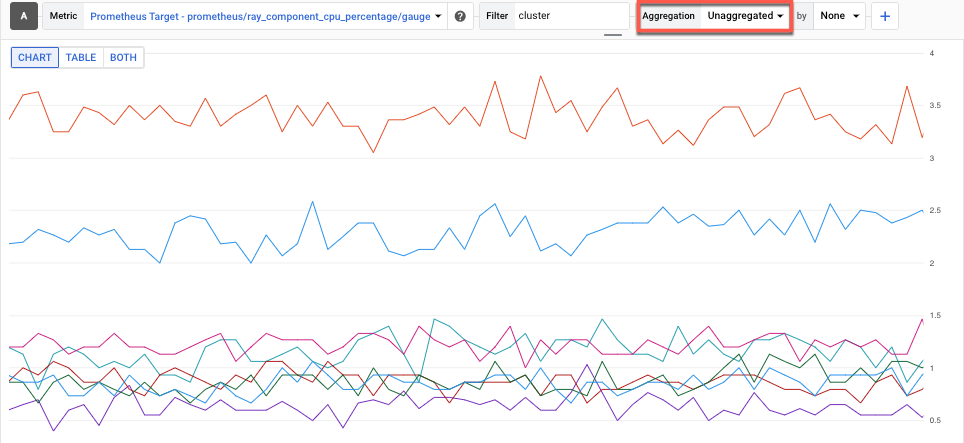
- 选择汇总方法以查看指标。也就是说,您可以选择查看未汇总的指标,这些指标会显示每个 Ray 进程的 CPU 利用率:
- 选择 CPU 利用率百分比作为受监控的指标:
GCM 信息中心
如需为 Ray on Vertex AI 导入 Grafana 信息中心,请遵循 Cloud Monitoring 信息中心的导入您自己的 Grafana 信息中心中的指南。
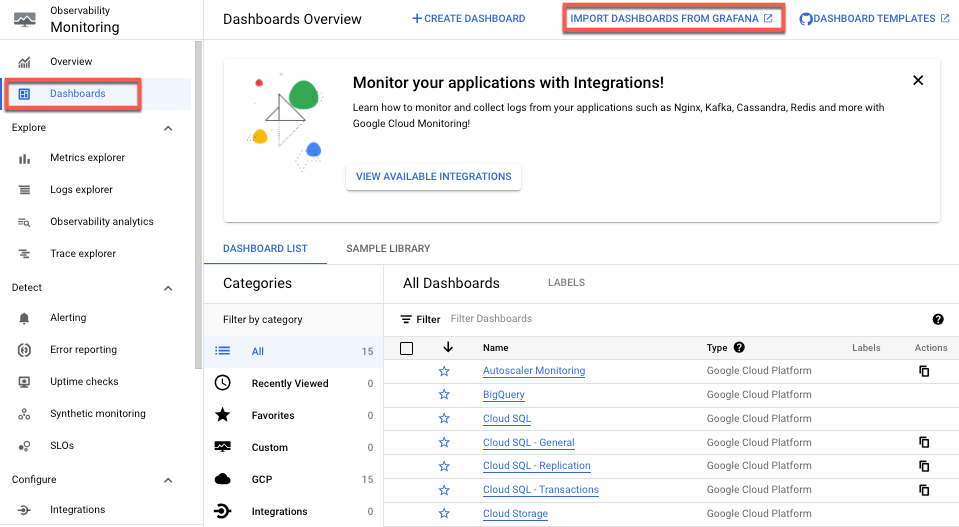
您只需提供 Grafana 信息中心 JSON 文件即可。OSS Ray 通过提供默认信息中心 Grafana JSON 文件来支持此手动设置。
监控指标
来自用户拥有的 Grafana
如果您已运行 Grafana 服务器,则还有一种方法可以将 Vertex AI Prometheus 指标上的所有 Ray 集群导出到现有的 Grafana 服务器。为此,请按照 GMP 使用 Grafana 进行查询指导操作。这样,您就可以将新的 Grafana 数据源添加到现有的 Grafana 服务器,并使用数据源同步器将新的 Grafana Prometheus 数据源同步到 Ray on Vertex AI 指标。
请务必使用数据源同步器配置新添加的 Grafana 数据源并对其进行身份验证。按照配置 Grafana 数据源并进行身份验证中提供的步骤操作。
同步后,您可以根据 Ray on Vertex AI 指标创建和添加所需的任何信息中心。
默认情况下,Ray on Vertex AI 指标收集处于启用状态。以下是如何使用 Vertex AI SDK for Python 停用这些功能:
vertex_ray.create_ray_cluster(..., enable_metrics_collection=False, ...)
调试 Ray 集群
如需调试 Ray 集群,请使用头节点交互式 Shell:
Google Cloud 控制台
如需访问头节点交互式 Shell,请执行以下操作:
- 在 Google Cloud 控制台中,前往 Ray on Vertex AI 页面。
前往 Ray on Vertex AI - 确保您位于正确的项目中。

- 选择要检查的集群。 系统会显示基本信息部分。
- 在访问链接部分中,点击头节点交互式 Shell 的链接。此时会显示头节点交互式 Shell。
- 按照使用交互式 Shell 监控和调试训练中的说明操作。