Nesta página, mostramos como visualizar os registros de rastreamento associados aos clusters do Ray e monitorar as métricas do Ray na Vertex AI. Também são fornecidas orientações para depurar clusters do Ray.
Ver registros
Ao executar tarefas com o cluster do Ray na Vertex AI, os registros de rastreamento são gerados e armazenados automaticamente no Cloud Logging e no painel do Ray de código aberto. Nesta seção, descrevemos como acessar os registros gerados pelo console Google Cloud .
Antes de começar, leia a Visão geral do Ray na Vertex AI e configure todas as ferramentas necessárias como pré-requisito.Painel do Ray OSS
É possível visualizar os arquivos de registro do Ray de código aberto por meio do painel do Ray OSS:
No console Google Cloud , acesse a página do Ray na Vertex AI.
Na linha do cluster que você criou, selecione no menu mais ações.
Selecione o link do dashboard do Ray OSS. O painel é aberto em outra guia.
Acesse a visualização Registros no canto superior direito do menu:
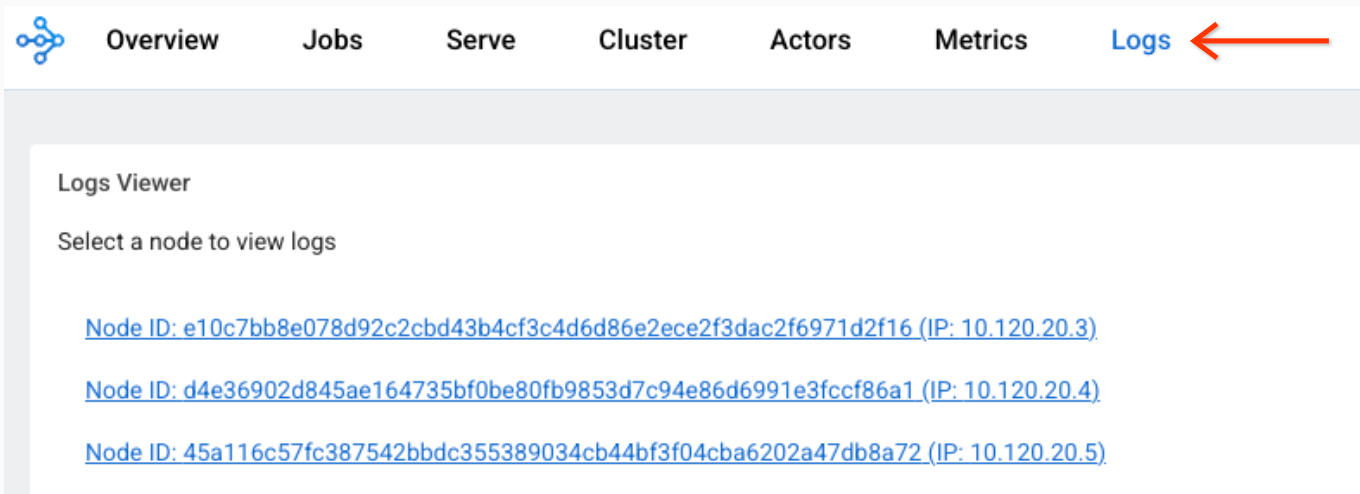
Clique em cada nó para ver os arquivos de registro associados a ele.
Console do Cloud Logging
-
No console Google Cloud , acesse a página Análise de registros.
Acessar a Análise de registros
Se você usar a barra de pesquisa para encontrar essa página, selecione o resultado com o subtítulo Logging.
Selecione um projeto, uma pasta ou uma organização Google Cloud .
Para exibir todos os registros do Ray, insira a consulta a seguir no campo query-editor e clique em Executar consulta:
resource.labels.task_name="ray-cluster-logs"
Para reduzir os registros a um cluster do Ray específico, adicione a seguinte linha à consulta e clique em Executar consulta:
labels."ml.googleapis.com/ray_cluster_id"=CLUSTER_NAME
Substitua CLUSTER_NAME pelo nome do cluster do Ray. No console Google Cloud , acesse Vertex AI > Ray na Vertex AI, onde você verá uma lista de nomes de clusters em cada região.
Para reduzir ainda mais os registros a um arquivo de registro específico, como
raylet.out, clique no nome do registro em Campos de registro -> Nome do registro.É possível agrupar entradas de registro semelhantes:
Em Resultados da consulta, clique em uma entrada de registro para expandi-la.
Em
jsonPayload, clique no valortailed_path. Será exibido um menu suspenso.Clique em Mostrar entradas correspondentes.
Desativar registros
Por padrão, o Ray no Cloud Logging da Vertex AI está ativado.
Para desativar a exportação de registros do Ray para o Cloud Logging, use o seguinte comando do SDK da Vertex AI para Python:
vertex_ray.create_ray_cluster(..., enable_logging=False, ...)
Você pode ver os arquivos de log do Ray no painel do Ray mesmo se o recurso Ray on Vertex AI Cloud Logging estiver desativado.
Monitorar as métricas
É possível visualizar as métricas do Ray na Vertex AI de diferentes maneiras usando o Google Cloud Monitoring (GCM). Como alternativa, é possível exportar as métricas do GCM para seu próprio servidor Grafana.
Monitorar métricas no GCM
Há duas maneiras de visualizar as métricas do Ray na Vertex AI no GCM.
- Use a visualização direta no Metrics Explorer.
Importe o painel do Grafana.
Metrics Explorer
Para usar a visualização direta no Metrics Explorer, siga estas etapas:
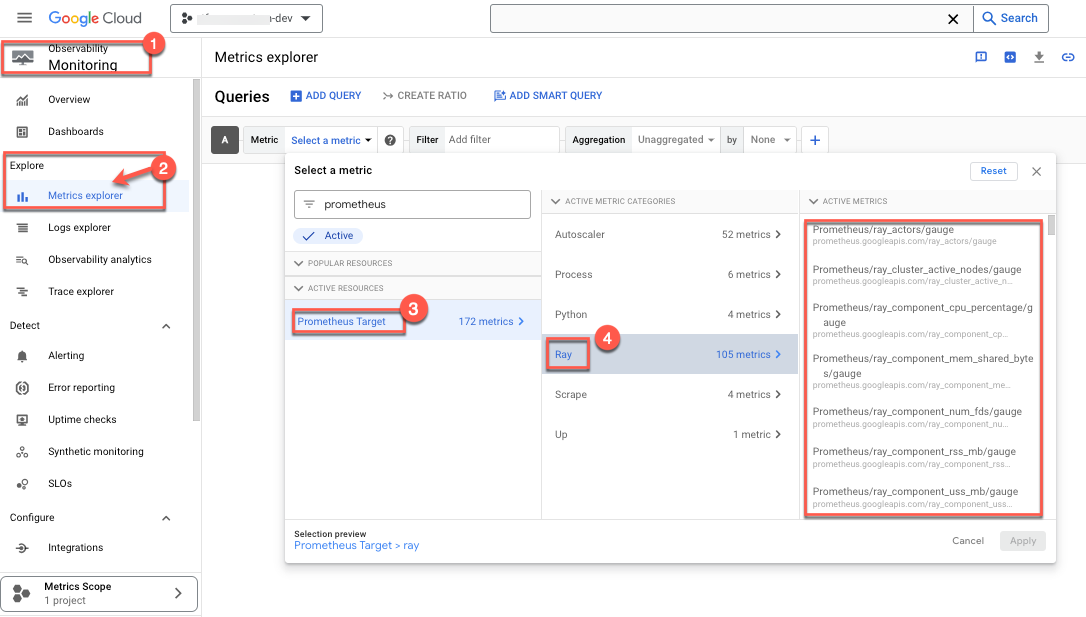
- Acesse o Console do Google Cloud Monitoring.
- Em Explorar, selecione Metrics Explorer.
- Em Recursos ativos, selecione Destino do Prometheus. A opção Categorias de métricas ativas será exibida.
Selecione Ray.
Uma lista de métricas será exibida:
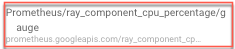
- Selecione as métricas que você quer monitorar. Exemplo:
- Escolha a porcentagem de utilização da CPU como uma métrica monitorada:
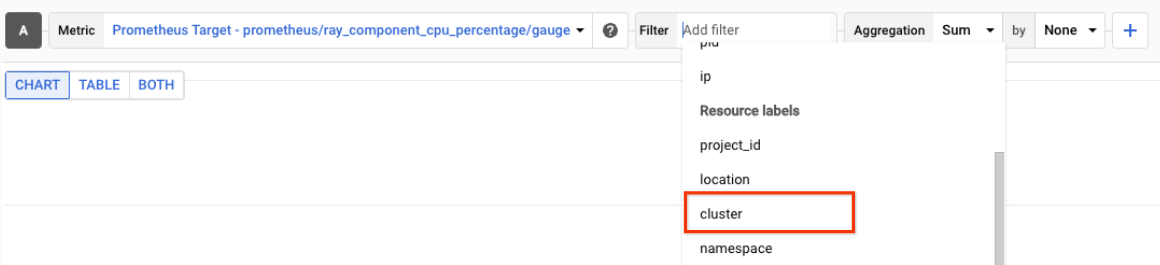
- Selecionar um filtro. Por exemplo, selecione o cluster:
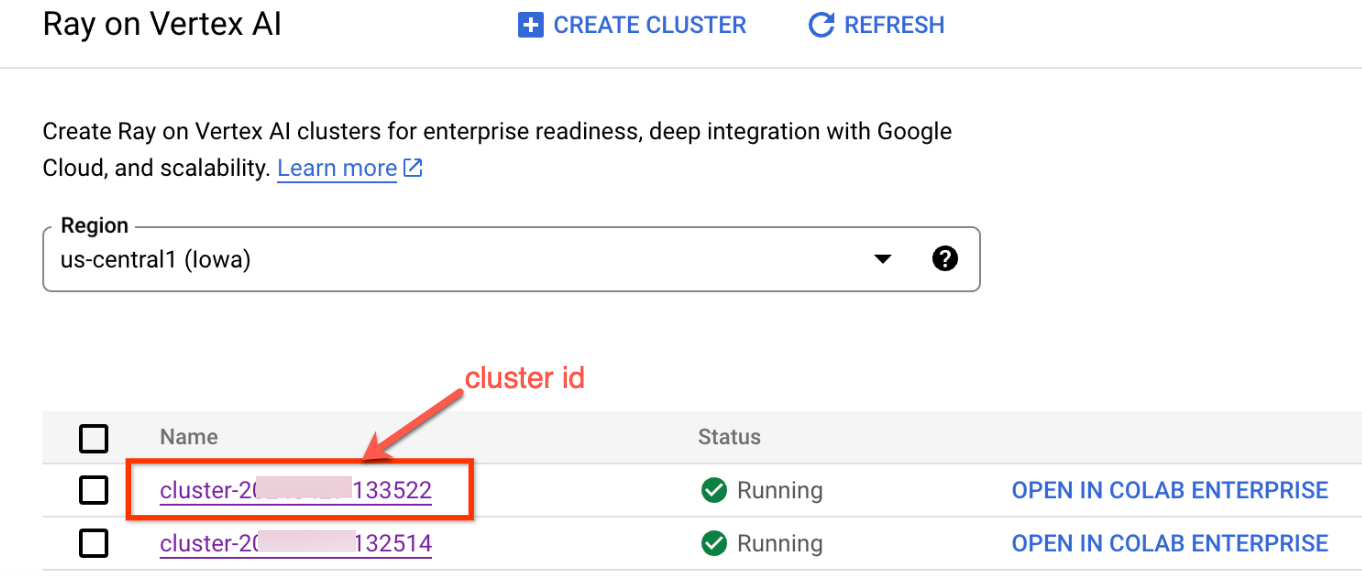
 Use o ID do cluster para monitorar apenas as métricas acima de um cluster específico. Para localizar o ID do cluster,
siga estas etapas:
Use o ID do cluster para monitorar apenas as métricas acima de um cluster específico. Para localizar o ID do cluster,
siga estas etapas:
No console Google Cloud , acesse a página Ray.
- Verifique se você está no projeto em que quer criar o experimento.
- Em Nome, aparece uma lista de IDs de cluster.
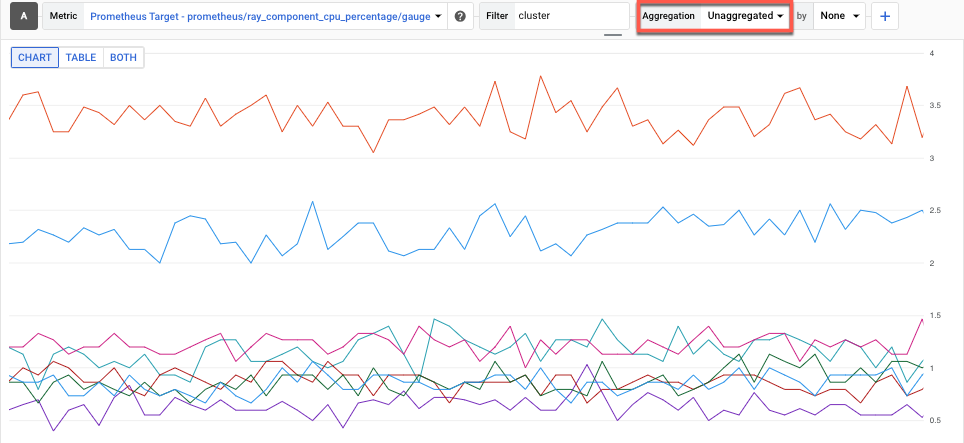
- Selecione o método Agregação para conferir as métricas. Ou seja, é possível visualizar métricas não agregadas, que mostram a utilização da CPU de cada processo do Ray:
- Escolha a porcentagem de utilização da CPU como uma métrica monitorada:
Painel do GCM
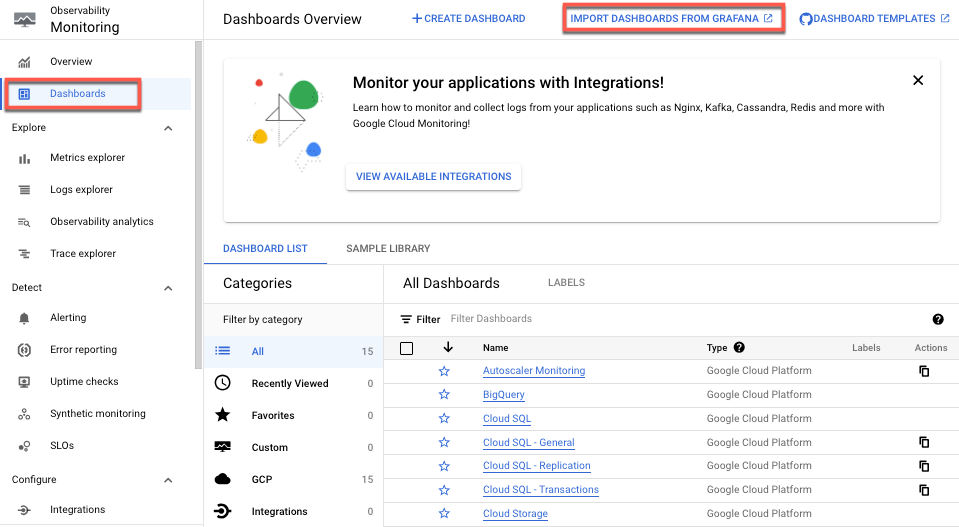
Para importar um painel do Grafana para o Ray na Vertex AI, siga as diretrizes do painel do Cloud Monitoring, Importar seu próprio painel do Grafana.
Você só precisa de um arquivo JSON do painel do Grafana. O OSS Ray é compatível com essa configuração manual. Para isso, basta fornecer o arquivo JSON do Grafana do painel padrão.
Monitorar as métricas
do Grafana do usuário
Se você já tiver um servidor do Grafana em execução, também poderá exportar todos os clusters do Ray nas métricas do Prometheus da Vertex AI para o servidor do Grafana. Para fazer isso, siga a orientação do GMP Consulta usando Grafana. Isso permite adicionar uma nova fonte de dados do Grafana ao servidor do Grafana e usar o sincronizador para sincronizar a nova fonte do Grafana Prometheus com as métricas do Ray na Vertex AI.
É importante configurar e autenticar a fonte de dados do Grafana recém-adicionada usando o sincronizador. Siga as etapas em Configurar e autenticar a fonte de dados do Grafana.
Depois da sincronização, é possível criar e adicionar qualquer painel necessário com base nas métricas do Ray na Vertex AI.
Por padrão, as coleções de métricas do Ray na Vertex AI estão ativadas. Confira como desativá-los usando o SDK da Vertex AI para Python:
vertex_ray.create_ray_cluster(..., enable_metrics_collection=False, ...)
Depurar clusters do Ray
Para depurar clusters do Ray, use o shell interativo do nó principal:
Google Cloud console
Para acessar o shell interativo do nó principal, faça o seguinte:
- No console Google Cloud , acesse a página Ray na Vertex AI.
Acessar o Ray na Vertex AI - Verifique se você está no projeto correto.
- Selecione o cluster que você quer examinar. A seção Informações básicas é exibida.
- Na seção Links de acesso, clique no link Shell interativo do nó principal. O shell interativo do nó principal é exibido.
- Siga as instruções descritas em Monitorar e depurar o treinamento com um shell interativo.