When you run a job, Model Monitoring v2 consumes data from your target and baseline datasets, calculates metrics, and potentially generates alerts. Model Monitoring v2 offers on-demand jobs for ad hoc monitoring or scheduled jobs for continuous monitoring. No matter which option you choose, each job is a single batch execution.
For more information about monitoring objectives and supported models, see Model Monitoring v2 overview and Set up model monitoring.
Run a job on demand
Run a one-time monitoring job. Set the target and baseline datasets as well as the monitoring specs for the objectives to monitor. Your configuration overrides any defaults, if set, that are defined by the model monitor.
Console
In the Google Cloud console, go to the Monitoring page.
Click the model monitor that you want to run a monitoring job for.
On the model monitor details page, click Run now to configure the monitoring job.
Configure your job or use the defaults as defined in the model monitor.
Click Run.
Python SDK
from vertexai.resources.preview import ml_monitoring

FEATURE_THRESHOLDS = {
  "culmen_length_mm": 0.001,
  "body_mass_g": 0.002,
}

FEATURE_DRIFT_SPEC=ml_monitoring.spec.DataDriftSpec(
  categorical_metric_type="l_infinity",
  numeric_metric_type="jensen_shannon_divergence",
  default_categorical_alert_threshold=0.001,
  default_numeric_alert_threshold=0.002,
  feature_alert_thresholds=FEATURE_THRESHOLDS,
)

PREDICTION_OUTPUT_DRIFT_SPEC=ml_monitoring.spec.DataDriftSpec(
  categorical_metric_type="l_infinity",
  numeric_metric_type="jensen_shannon_divergence",
  default_categorical_alert_threshold=0.001,
  default_numeric_alert_threshold=0.001,
)

FEATURE_ATTRIBUTION_SPEC=ml_monitoring.spec.FeatureAttributionSpec(
  default_alert_threshold=0.0003,
  feature_alert_thresholds={"cnt_ad_reward":0.0001},
)

EXPLANATION_SPEC=ExplanationSpec(
  parameters=ExplanationParameters(
      {"sampled_shapley_attribution": {"path_count": 2}}
  ),
  metadata=ExplanationMetadata(
      inputs={
          "cnt_ad_reward": ExplanationMetadata.InputMetadata({
              "input_tensor_name": "cnt_ad_reward",
              "encoding": "IDENTITY",
              "modality": "numeric"
          }),
          ...
      },
      ...
  )
)

TRAINING_DATASET=ml_monitoring.spec.MonitoringInput(
  gcs_uri=TRAINING_URI,
  data_format="csv"
)

TARGET_DATASET=ml_monitoring.spec.MonitoringInput(
  table_uri=BIGQUERY_URI
)

model_monitoring_job=my_model_monitor.run(
  display_name=JOB_DISPLAY_NAME,
  baseline_dataset=TRAINING_DATASET,
  target_dataset=TARGET_DATASET,
  tabular_objective_spec=ml_monitoring.spec.TabularObjective(
      # Optional: set to monitor input feature drift.
      feature_drift_spec=FEATURE_DRIFT_SPEC,

      # Optional: set to monitor prediction output drift.
      prediction_output_drift_spec=PREDICTION_OUTPUT_DRIFT_SPEC,

      # Optional: set to monitor feature attribution drift.
      feature_attribution_spec=FEATURE_ATTRIBUTION_SPEC
  ),

  # Optional: additional configurations to override default values.
  explanation_config=EXPLANATION_SPEC,
  notification_spec=NOTIFICATION_SPEC,
  output_spec=OUTPUT_SPEC
)
Schedule continuous runs
You can set one or more schedule runs for a model monitor. To use continuous monitoring with time specifications, your dataset must have a timestamp column so that Model Monitoring v2 can retrieve the data from the specified time range.
Console
In the Google Cloud console, go to the Monitoring page.
Click the model monitor that you want to configure continuous monitoring for.
Click Schedule a recurring run.
Set your target and baseline datasets and then click Continue.
Set the objectives to monitor, their thresholds, notification settings when an alert is generated.
Click Continue.
Configure a schedule for recurring jobs:
- Specify a name for the scheduler.
- For Start time, specify when the first job will start.
- For Frequency, use a cron expression to set the frequency, and then set the time zone.
- For Ends, specify when the scheduler ends.
Click Create.
Python SDK
To set the frequency of monitoring jobs, use a cron expression.
my_model_monitoring_schedule=my_model_monitor.create_schedule(
  display_name=SCHEDULE_DISPLAY_NAME,
  # Every day at 0:00(midnight)
  cron='"0 * * * *"',
  baseline_dataset=ml_monitoring.spec.MonitoringInput(
      endpoints=[ENDPOINT_RESOURCE_NAME],
      offset="24h",
      window="24h",
  ),
  target_dataset=ml_monitoring.spec.MonitoringInput(
      endpoints=[ENDPOINT_RESOURCE_NAME],
      window="24h"
  ),
  tabular_objective_spec=ml_monitoring.spec.TabularObjective(
      # Optional: set to monitor input feature drift.
      feature_drift_spec=FEATURE_DRIFT_SPEC,

      # Optional: set to monitor prediction output drift.
      prediction_output_drift_spec=PREDICTION_OUTPUT_DRIFT_SPEC,

      # Optional: set to monitor feature attribution drift.
      feature_attribution_spec=FEATURE_ATTRIBUTION_SPEC
  ),

  # Optional: additional configurations to override default values.
  explanation_config=EXPLANATION_SPEC,
  output_spec=OUTPUT_SPEC,
  notification_spec=NOTIFICATION_SPEC,
)
Pause or resume a schedule
You can pause and resume a schedule to skip or temporarily halt monitoring job runs.
Console
In the Google Cloud console, go to the Monitoring page.
Click the model monitor that contains the schedule to modify.
On the details page, go to the Schedules tab.
Click the schedule to modify.
Click Pause or Resume to pause or resume the schedule.
Python SDK
# Pause schedule
my_model_monitor.pause_schedule(my_monitoring_schedule.name)

# Resume schedule
my_model_monitor.resume_schedule(my_monitoring_schedule.name)
Delete a schedule
Delete a schedule if you're not using it. Your existing data remains as well as any previously created jobs.
Console
In the Google Cloud console, go to the Monitoring page.
Click the model monitor that contains the schedule to modify.
On the details page, go to the Schedules tab.
Click the schedule to modify.
Click Delete and Delete again to confirm.
Python SDK
my_model_monitor.delete_schedule(my_monitoring_schedule.name)
Analyze monitoring job results
You can use the Google Cloud console to visualize the data distributions for each monitoring objective and learn which changes led to drift over time.
The visualizations show a histogram comparing the data distribution between the target and the baseline data. Based on your level of tolerance, you might, for example, decide to adjust your feature generation pipeline or retrain the model.
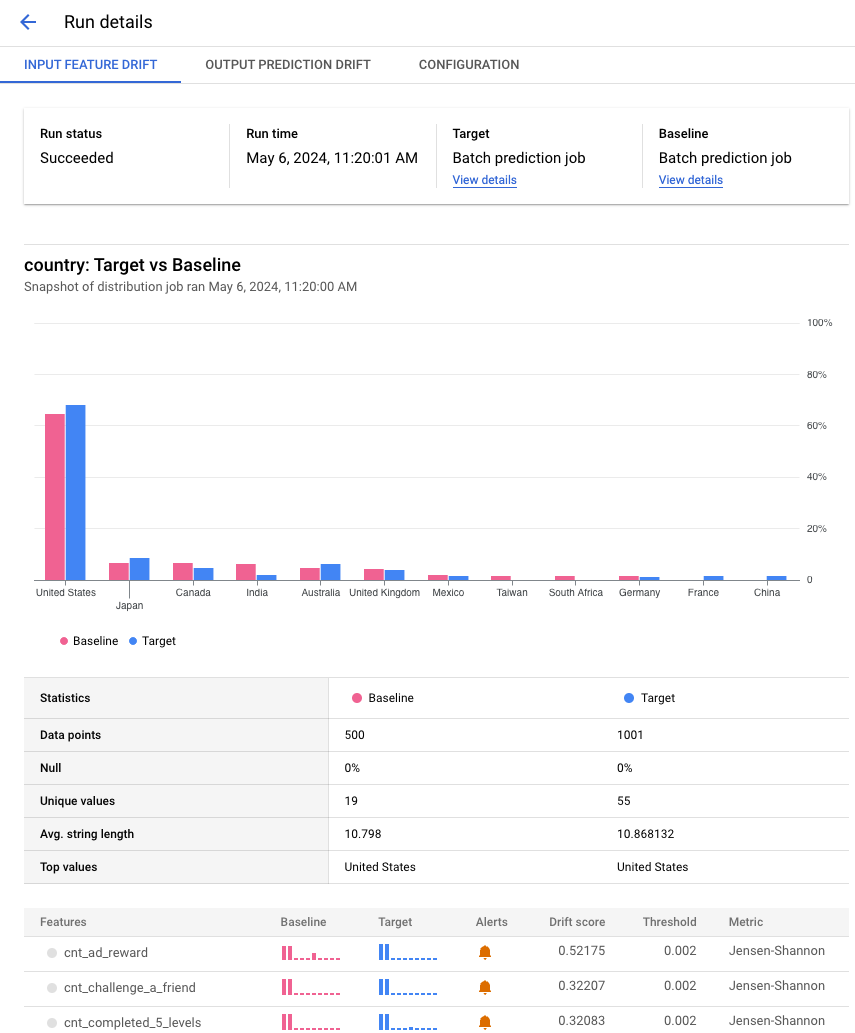
View job details
View details about a monitoring job run such as a list of monitored features and which features generated an alert.
Console
In the Google Cloud console, go to the Monitoring page.
Click the model monitor that contains the job to analyze.
On the Monitor details page, click the Runs tab.
From the list of runs, click a run to view its details such as all the features included in a run.
The following example shows a distribution comparison for the country feature from batch prediction jobs. The Google Cloud console also provide details about the comparison depending on the metric, such as the number of unique values, mean value, and the standard deviation.
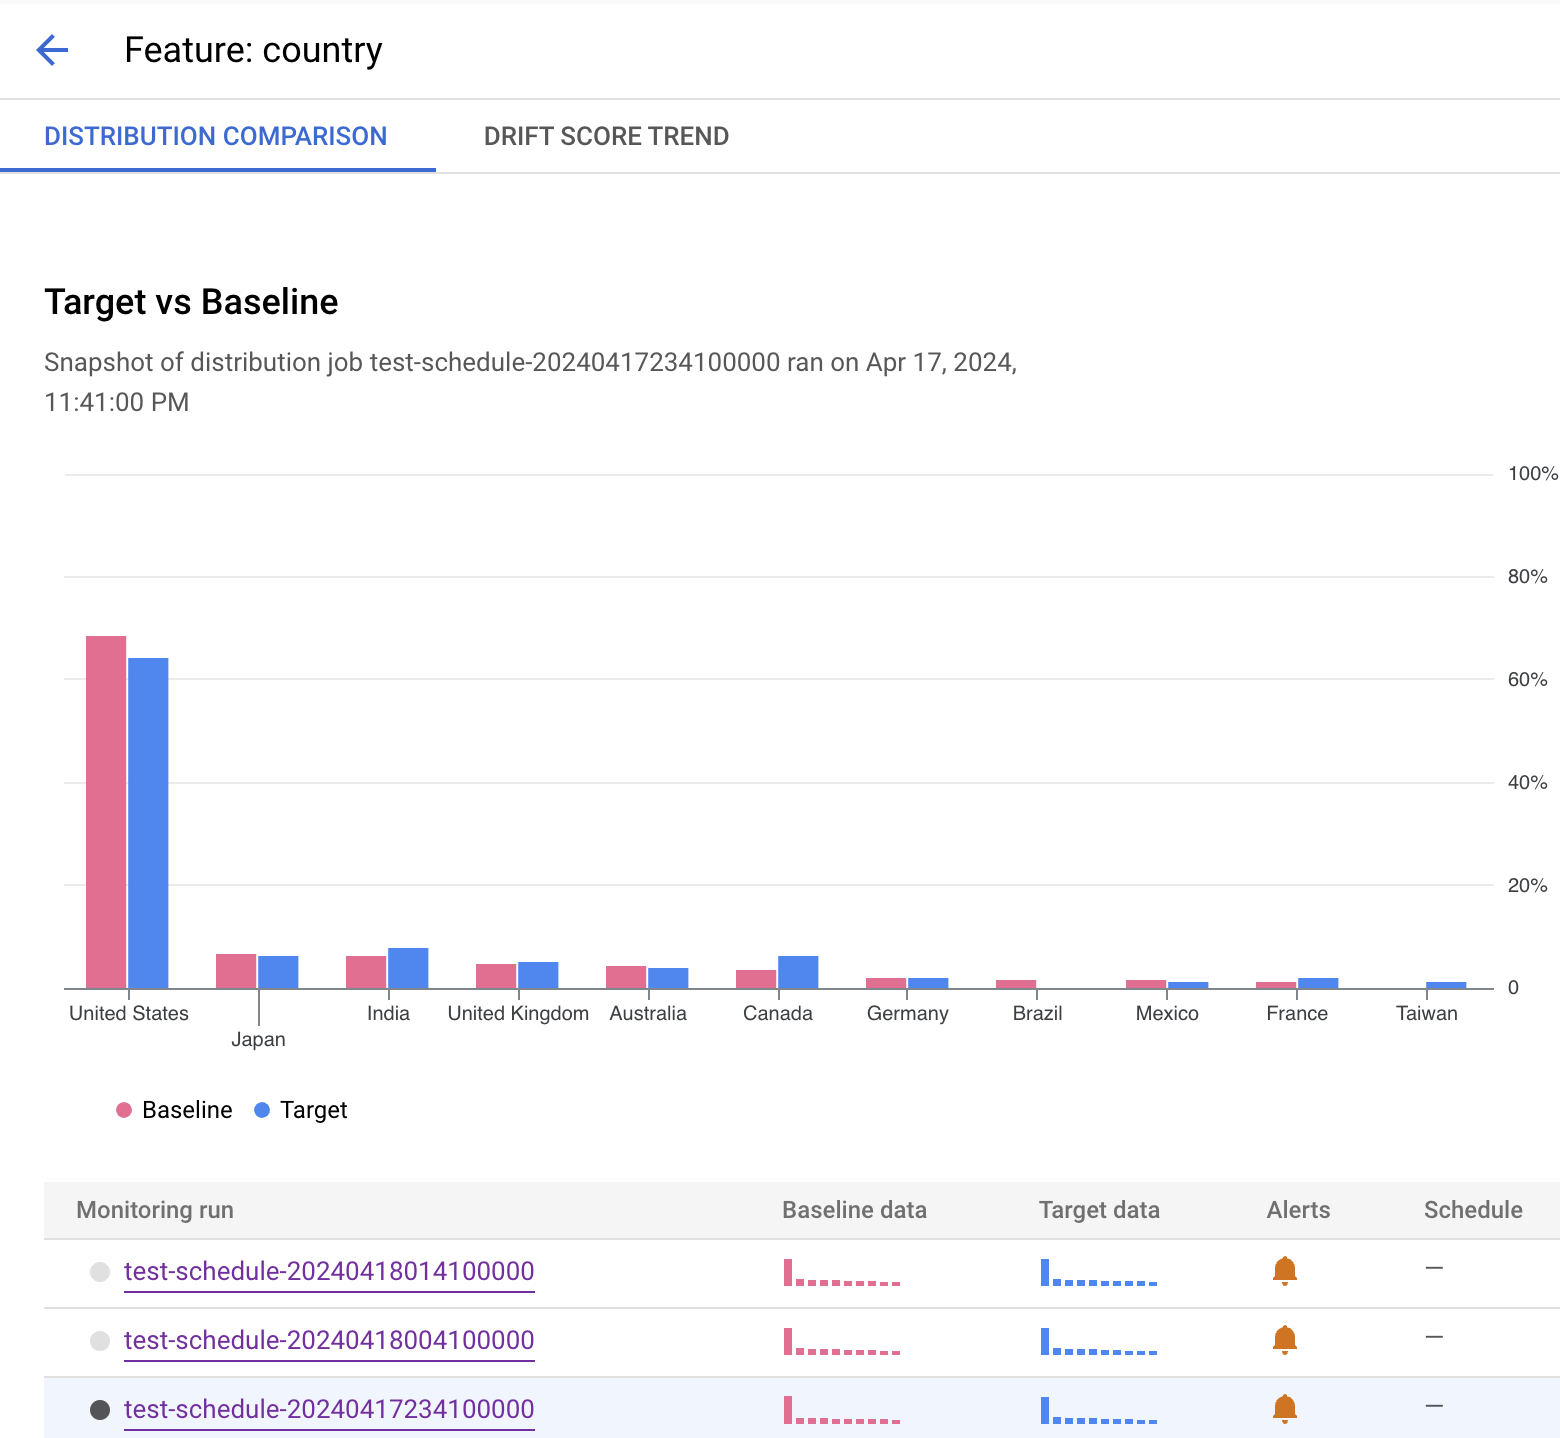
View feature details
View information about a feature and a list of monitoring jobs that include the feature.
Console
In the Google Cloud console, go to the Monitoring page.
Click the model monitor that contains the jobs to analyze.
In the Overview tab, you can view a summary, which includes trends in drift for all monitored objectives if you have continuous monitoring set up. You can also dive deeper into particular objectives to see details such as the monitored feature names and a list of monitoring runs.
The following example shows a distribution comparison for the country feature. After the histogram, you can see which runs generated an alert or select another monitoring job that includes monitoring data for this feature.