fromvertexai.resources.previewimportml_monitoringFEATURE_THRESHOLDS={"culmen_length_mm":0.001,"body_mass_g":0.002,}FEATURE_DRIFT_SPEC=ml_monitoring.spec.DataDriftSpec(categorical_metric_type="l_infinity",numeric_metric_type="jensen_shannon_divergence",default_categorical_alert_threshold=0.001,default_numeric_alert_threshold=0.002,feature_alert_thresholds=FEATURE_THRESHOLDS,)PREDICTION_OUTPUT_DRIFT_SPEC=ml_monitoring.spec.DataDriftSpec(categorical_metric_type="l_infinity",numeric_metric_type="jensen_shannon_divergence",default_categorical_alert_threshold=0.001,default_numeric_alert_threshold=0.001,)FEATURE_ATTRIBUTION_SPEC=ml_monitoring.spec.FeatureAttributionSpec(default_alert_threshold=0.0003,feature_alert_thresholds={"cnt_ad_reward":0.0001},)EXPLANATION_SPEC=ExplanationSpec(parameters=ExplanationParameters({"sampled_shapley_attribution":{"path_count":2}}),metadata=ExplanationMetadata(inputs={"cnt_ad_reward":ExplanationMetadata.InputMetadata({"input_tensor_name":"cnt_ad_reward","encoding":"IDENTITY","modality":"numeric"}),...},...))TRAINING_DATASET=ml_monitoring.spec.MonitoringInput(gcs_uri=TRAINING_URI,data_format="csv")TARGET_DATASET=ml_monitoring.spec.MonitoringInput(table_uri=BIGQUERY_URI)model_monitoring_job=my_model_monitor.run(display_name=JOB_DISPLAY_NAME,baseline_dataset=TRAINING_DATASET,target_dataset=TARGET_DATASET,tabular_objective_spec=ml_monitoring.spec.TabularObjective(# Optional: set to monitor input feature drift.feature_drift_spec=FEATURE_DRIFT_SPEC,# Optional: set to monitor prediction output drift.prediction_output_drift_spec=PREDICTION_OUTPUT_DRIFT_SPEC,# Optional: set to monitor feature attribution drift.feature_attribution_spec=FEATURE_ATTRIBUTION_SPEC),# Optional: additional configurations to override default values.explanation_config=EXPLANATION_SPEC,notification_spec=NOTIFICATION_SPEC,output_spec=OUTPUT_SPEC)
安排持续运行
您可以为模型监控设置一个或多个运行时间表。如需使用带时间指定的持续监控,您的数据集必须包含一个时间戳列,以便 Model Monitoring v2 可以从指定时间范围中检索数据。
my_model_monitoring_schedule=my_model_monitor.create_schedule(display_name=SCHEDULE_DISPLAY_NAME,# Every day at 0:00(midnight)cron='"0 * * * *"',baseline_dataset=ml_monitoring.spec.MonitoringInput(endpoints=[ENDPOINT_RESOURCE_NAME],offset="24h",window="24h",),target_dataset=ml_monitoring.spec.MonitoringInput(endpoints=[ENDPOINT_RESOURCE_NAME],window="24h"),tabular_objective_spec=ml_monitoring.spec.TabularObjective(# Optional: set to monitor input feature drift.feature_drift_spec=FEATURE_DRIFT_SPEC,# Optional: set to monitor prediction output drift.prediction_output_drift_spec=PREDICTION_OUTPUT_DRIFT_SPEC,# Optional: set to monitor feature attribution drift.feature_attribution_spec=FEATURE_ATTRIBUTION_SPEC),# Optional: additional configurations to override default values.explanation_config=EXPLANATION_SPEC,output_spec=OUTPUT_SPEC,notification_spec=NOTIFICATION_SPEC,)
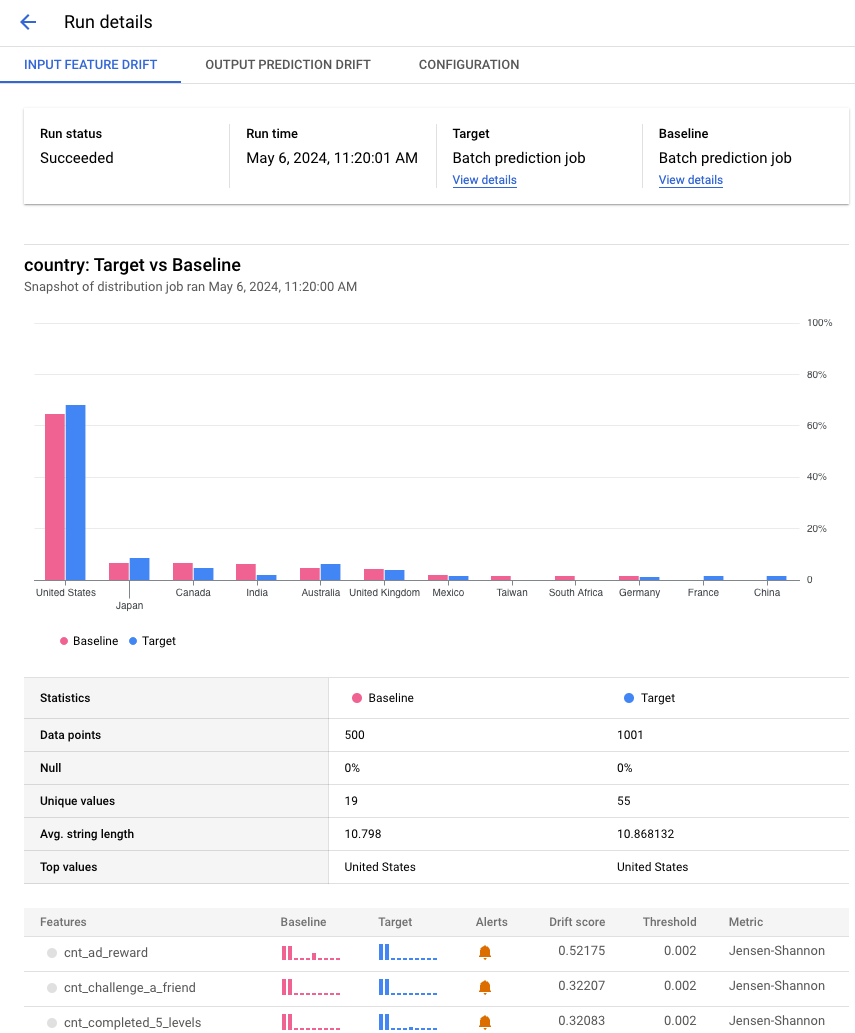
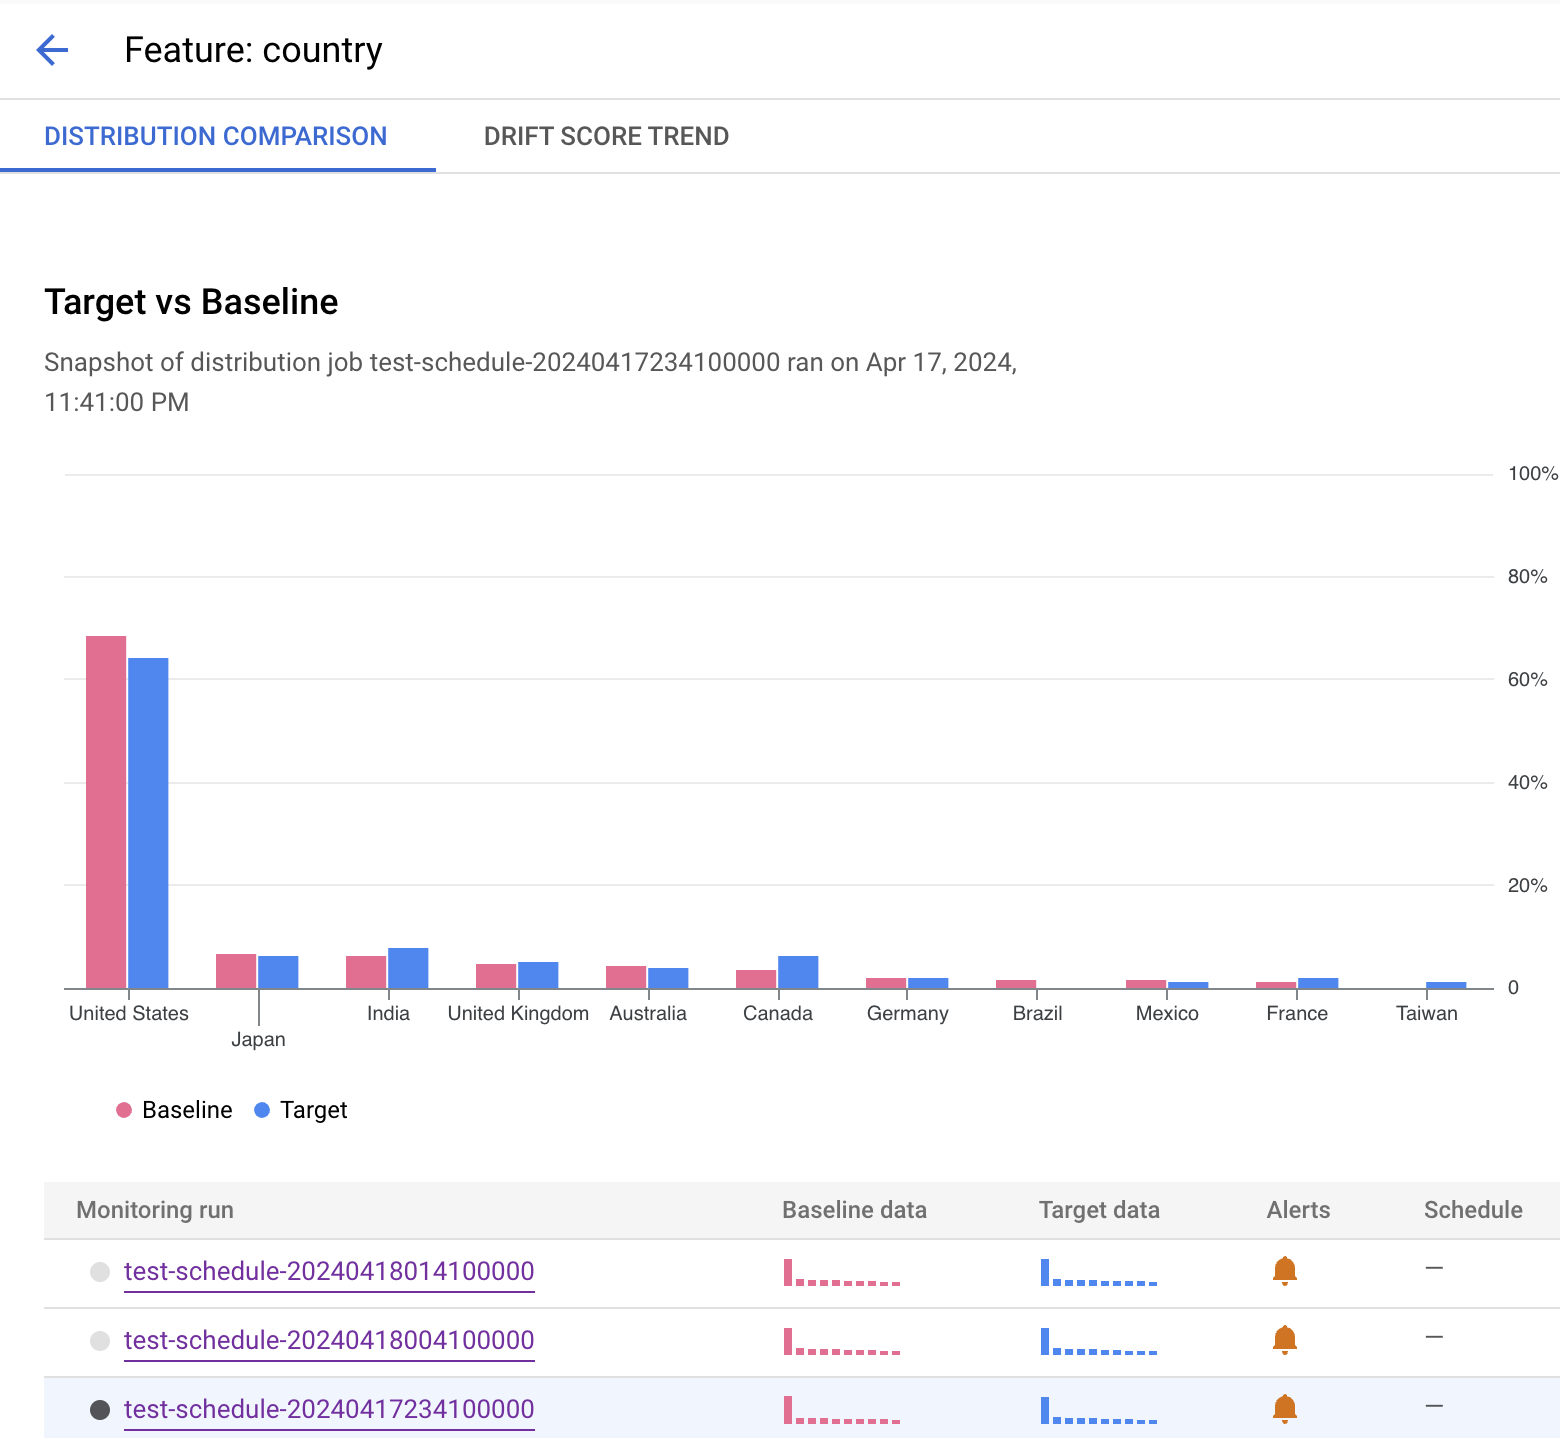
[[["易于理解","easyToUnderstand","thumb-up"],["解决了我的问题","solvedMyProblem","thumb-up"],["其他","otherUp","thumb-up"]],[["很难理解","hardToUnderstand","thumb-down"],["信息或示例代码不正确","incorrectInformationOrSampleCode","thumb-down"],["没有我需要的信息/示例","missingTheInformationSamplesINeed","thumb-down"],["翻译问题","translationIssue","thumb-down"],["其他","otherDown","thumb-down"]],["最后更新时间 (UTC):2025-09-03。"],[],[],null,["# Run monitoring jobs\n\n| **Preview**\n|\n|\n| This product or feature is subject to the \"Pre-GA Offerings Terms\" in the General Service Terms section\n| of the [Service Specific Terms](/terms/service-terms#1).\n|\n| Pre-GA products and features are available \"as is\" and might have limited support.\n|\n| For more information, see the\n| [launch stage descriptions](/products#product-launch-stages).\n\nWhen you run a job, Model Monitoring v2 consumes data from your target and baseline datasets,\ncalculates metrics, and potentially generates alerts. Model Monitoring v2 offers on-demand\njobs for ad hoc monitoring or scheduled jobs for continuous monitoring. No\nmatter which option you choose, each job is a single batch execution.\n\nFor more information about monitoring objectives and supported models, see\n[Model Monitoring v2 overview](/vertex-ai/docs/model-monitoring/overview#v2) and [Set up model monitoring](/vertex-ai/docs/model-monitoring/set-up-model-monitoring).\n\nRun a job on demand\n-------------------\n\nRun a one-time monitoring job. Set the target and baseline datasets as well as\nthe monitoring specs for the objectives to monitor. Your configuration overrides\nany defaults, if set, that are defined by the model monitor. \n\n### Console\n\n1. In the Google Cloud console, go to the **Monitoring** page.\n\n [Go to Monitoring](https://console.cloud.google.com/vertex-ai/model-monitoring/model-monitors)\n2. Click the model monitor that you want to run a monitoring job for.\n\n3. On the model monitor details page, click **Run now** to configure the\n monitoring job.\n\n4. Configure your job or use the defaults as defined in the model monitor.\n\n5. Click **Run**.\n\n### Python SDK\n\n```python\nfrom vertexai.resources.preview import ml_monitoring\n\nFEATURE_THRESHOLDS = {\n \"culmen_length_mm\": 0.001,\n \"body_mass_g\": 0.002,\n}\n\nFEATURE_DRIFT_SPEC=ml_monitoring.spec.DataDriftSpec(\n categorical_metric_type=\"l_infinity\",\n numeric_metric_type=\"jensen_shannon_divergence\",\n default_categorical_alert_threshold=0.001,\n default_numeric_alert_threshold=0.002,\n feature_alert_thresholds=FEATURE_THRESHOLDS,\n)\n\nPREDICTION_OUTPUT_DRIFT_SPEC=ml_monitoring.spec.DataDriftSpec(\n categorical_metric_type=\"l_infinity\",\n numeric_metric_type=\"jensen_shannon_divergence\",\n default_categorical_alert_threshold=0.001,\n default_numeric_alert_threshold=0.001,\n)\n\nFEATURE_ATTRIBUTION_SPEC=ml_monitoring.spec.FeatureAttributionSpec(\n default_alert_threshold=0.0003,\n feature_alert_thresholds={\"cnt_ad_reward\":0.0001},\n)\n\nEXPLANATION_SPEC=ExplanationSpec(\n parameters=ExplanationParameters(\n {\"sampled_shapley_attribution\": {\"path_count\": 2}}\n ),\n metadata=ExplanationMetadata(\n inputs={\n \"cnt_ad_reward\": ExplanationMetadata.InputMetadata({\n \"input_tensor_name\": \"cnt_ad_reward\",\n \"encoding\": \"IDENTITY\",\n \"modality\": \"numeric\"\n }),\n ...\n },\n ...\n )\n)\n\nTRAINING_DATASET=ml_monitoring.spec.MonitoringInput(\n gcs_uri=TRAINING_URI,\n data_format=\"csv\"\n)\n\nTARGET_DATASET=ml_monitoring.spec.MonitoringInput(\n table_uri=BIGQUERY_URI\n)\n\nmodel_monitoring_job=my_model_monitor.run(\n display_name=JOB_DISPLAY_NAME,\n baseline_dataset=TRAINING_DATASET,\n target_dataset=TARGET_DATASET,\n tabular_objective_spec=ml_monitoring.spec.TabularObjective(\n # Optional: set to monitor input feature drift.\n feature_drift_spec=FEATURE_DRIFT_SPEC,\n\n # Optional: set to monitor prediction output drift.\n prediction_output_drift_spec=PREDICTION_OUTPUT_DRIFT_SPEC,\n\n # Optional: set to monitor feature attribution drift.\n feature_attribution_spec=FEATURE_ATTRIBUTION_SPEC\n ),\n\n # Optional: additional configurations to override default values.\n explanation_config=EXPLANATION_SPEC,\n notification_spec=NOTIFICATION_SPEC,\n output_spec=OUTPUT_SPEC\n)\n```\n\nSchedule continuous runs\n------------------------\n\nYou can set one or more schedule runs for a model monitor. To use continuous\nmonitoring with time specifications, your dataset must have a timestamp column\nso that Model Monitoring v2 can retrieve the data from the specified time range. \n\n### Console\n\n1. In the Google Cloud console, go to the **Monitoring** page.\n\n [Go to Monitoring](https://console.cloud.google.com/vertex-ai/model-monitoring/model-monitors)\n2. Click the model monitor that you want to configure continuous monitoring\n for.\n\n3. Click **Schedule a recurring run**.\n\n4. Set your target and baseline datasets and then click **Continue**.\n\n5. Set the objectives to monitor, their thresholds, notification settings when\n an alert is generated.\n\n6. Click **Continue**.\n\n7. Configure a schedule for recurring jobs:\n\n 1. Specify a name for the scheduler.\n 2. For **Start time**, specify when the first job will start.\n 3. For **Frequency** , use a [cron expression](/scheduler/docs/configuring/cron-job-schedules) to set the frequency, and then set the time zone.\n 4. For **Ends**, specify when the scheduler ends.\n8. Click **Create**.\n\n### Python SDK\n\nTo set the frequency of monitoring jobs, use a [cron expression](/scheduler/docs/configuring/cron-job-schedules). \n\n```python\nmy_model_monitoring_schedule=my_model_monitor.create_schedule(\n display_name=SCHEDULE_DISPLAY_NAME,\n # Every day at 0:00(midnight)\n cron='\"0 * * * *\"',\n baseline_dataset=ml_monitoring.spec.MonitoringInput(\n endpoints=[ENDPOINT_RESOURCE_NAME],\n offset=\"24h\",\n window=\"24h\",\n ),\n target_dataset=ml_monitoring.spec.MonitoringInput(\n endpoints=[ENDPOINT_RESOURCE_NAME],\n window=\"24h\"\n ),\n tabular_objective_spec=ml_monitoring.spec.TabularObjective(\n # Optional: set to monitor input feature drift.\n feature_drift_spec=FEATURE_DRIFT_SPEC,\n\n # Optional: set to monitor prediction output drift.\n prediction_output_drift_spec=PREDICTION_OUTPUT_DRIFT_SPEC,\n\n # Optional: set to monitor feature attribution drift.\n feature_attribution_spec=FEATURE_ATTRIBUTION_SPEC\n ),\n\n # Optional: additional configurations to override default values.\n explanation_config=EXPLANATION_SPEC,\n output_spec=OUTPUT_SPEC,\n notification_spec=NOTIFICATION_SPEC,\n)\n```\n\n### Pause or resume a schedule\n\nYou can pause and resume a schedule to skip or temporarily halt monitoring job\nruns. \n\n### Console\n\n1. In the Google Cloud console, go to the **Monitoring** page.\n\n [Go to Monitoring](https://console.cloud.google.com/vertex-ai/model-monitoring/model-monitors)\n2. Click the model monitor that contains the schedule to modify.\n\n3. On the details page, go to the **Schedules** tab.\n\n4. Click the schedule to modify.\n\n5. Click **Pause** or **Resume** to pause or resume the schedule.\n\n### Python SDK\n\n```python\n# Pause schedule\nmy_model_monitor.pause_schedule(my_monitoring_schedule.name)\n\n# Resume schedule\nmy_model_monitor.resume_schedule(my_monitoring_schedule.name)\n```\n\n### Delete a schedule\n\nDelete a schedule if you're not using it. Your existing data remains as well as\nany previously created jobs. \n\n### Console\n\n1. In the Google Cloud console, go to the **Monitoring** page.\n\n [Go to Monitoring](https://console.cloud.google.com/vertex-ai/model-monitoring/model-monitors)\n2. Click the model monitor that contains the schedule to modify.\n\n3. On the details page, go to the **Schedules** tab.\n\n4. Click the schedule to modify.\n\n5. Click **Delete** and **Delete** again to confirm.\n\n### Python SDK\n\n```python\nmy_model_monitor.delete_schedule(my_monitoring_schedule.name)\n```\n\nAnalyze monitoring job results\n------------------------------\n\nYou can use the Google Cloud console to visualize the data distributions for\neach monitoring objective and learn which changes led to drift over time.\n\nThe visualizations show a histogram comparing the data distribution between the\ntarget and the baseline data. Based on your level of tolerance, you might,\nfor example, decide to adjust your feature generation pipeline or retrain the\nmodel.\n\n### View job details\n\nView details about a monitoring job run such as a list of monitored features and\nwhich features generated an alert. \n\n### Console\n\n1. In the Google Cloud console, go to the **Monitoring** page.\n\n [Go to Monitoring](https://console.cloud.google.com/vertex-ai/model-monitoring/model-monitors)\n2. Click the model monitor that contains the job to analyze.\n\n3. On the **Monitor details** page, click the **Runs** tab.\n\n4. From the list of runs, click a run to view its details such as all the\n features included in a run.\n\n The following example shows a distribution comparison for the **country**\n feature from batch prediction jobs. The Google Cloud console also\n provide details about the comparison depending on the metric, such as the\n number of unique values, mean value, and the standard deviation.\n\n### View feature details\n\nView information about a feature and a list of monitoring jobs that include the\nfeature. \n\n### Console\n\n1. In the Google Cloud console, go to the **Monitoring** page.\n\n [Go to Monitoring](https://console.cloud.google.com/vertex-ai/model-monitoring/model-monitors)\n2. Click the model monitor that contains the jobs to analyze.\n\n3. In the **Overview** tab, you can view a summary, which includes trends in\n drift for all monitored objectives if you have continuous monitoring\n set up. You can also dive deeper into particular objectives to see details\n such as the monitored feature names and a list of monitoring runs.\n\n The following example shows a distribution comparison for the **country**\n feature. After the histogram, you can see which runs generated an alert or\n select another monitoring job that includes monitoring data for this\n feature."]]