本页介绍了六个关键步骤,可帮助您快速开始使用 Looker Studio。
 从报告开始
从报告开始
借助报告,您可以直观呈现数据、获取数据洞见,并与他人分享这些洞见。
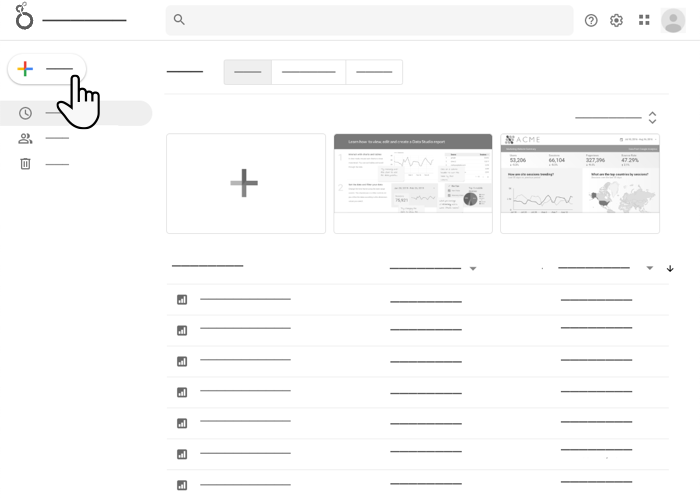
登录 Looker Studio 后,系统会显示首页,并选中报告标签页。您有权访问的所有报告都会显示在屏幕中间。通过加号按钮,您可以创建新的空白报告,也可以从顶部预建的报告模板着手。
查看报告
如需查看与您共享的报告,请点击屏幕中间列表中的报告名称。
修改报告
如需修改报告,请按以下步骤操作:
- 查看报告。
- 点击右上角的
 修改。
修改。
如果您没有看到修改按钮,则表示相应报告的共享权限仅为可查看。如果报告的所有者允许,您可以创建副本,然后进行修改。
创建报告
如需创建报告,请按以下步骤操作:
- 点击左上角的
 创建。
创建。 - 选择报告。
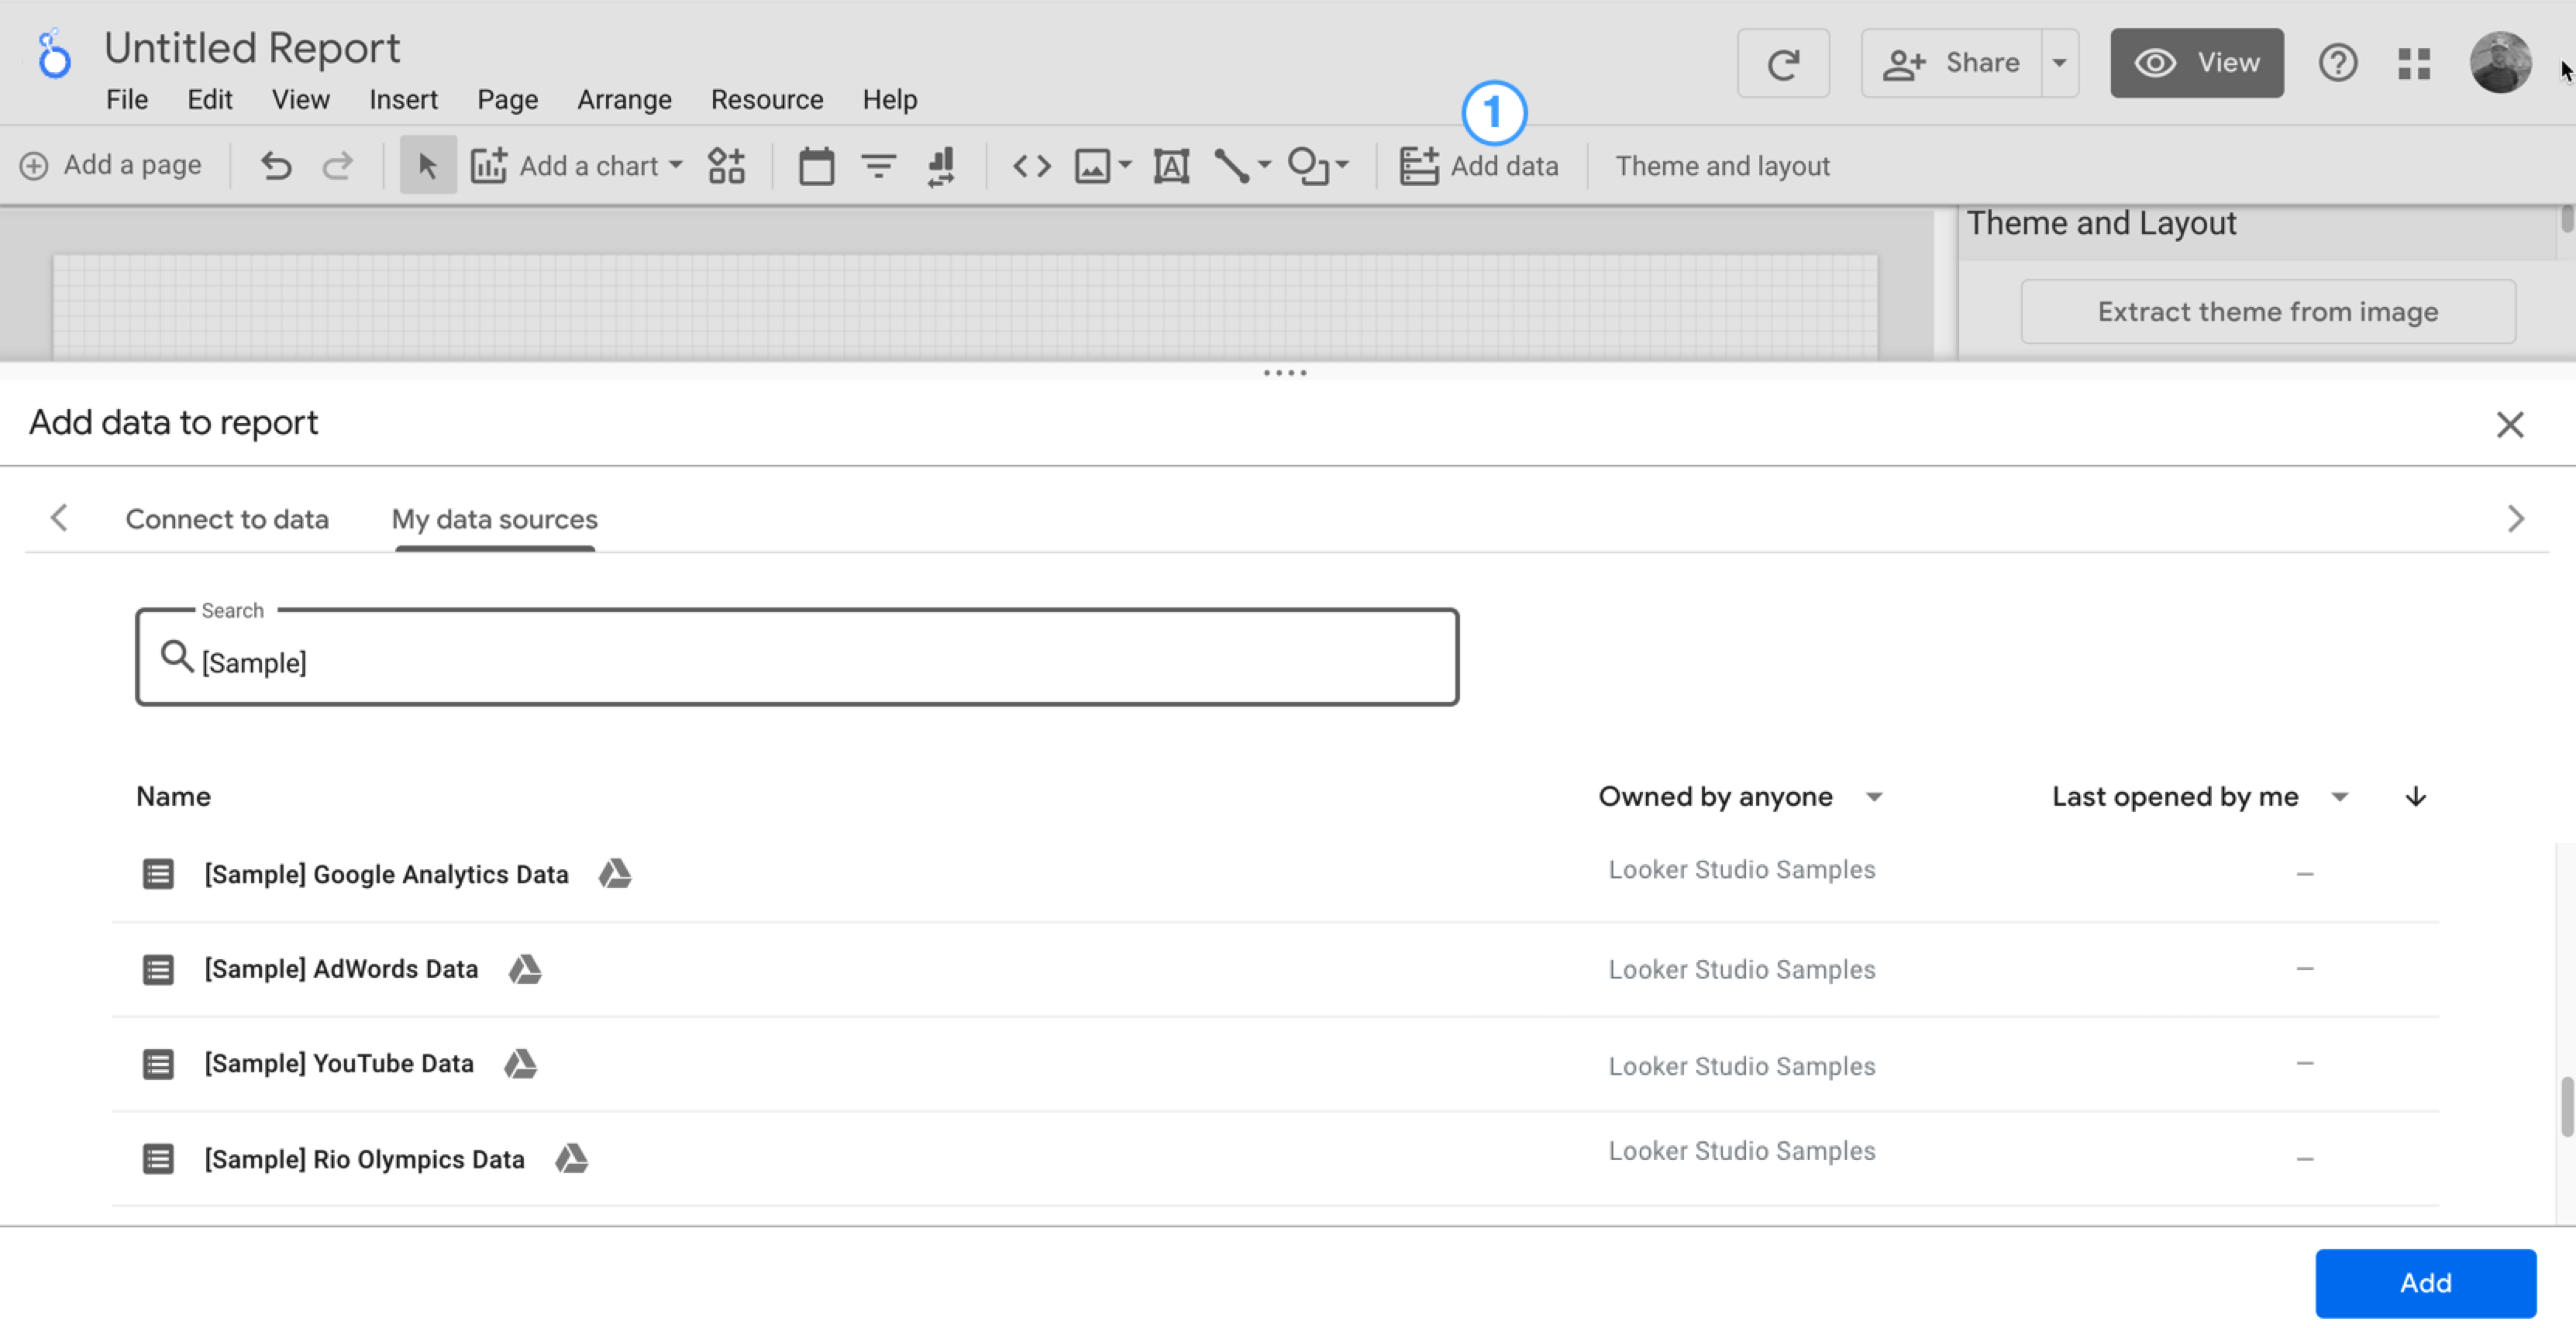
报告编辑器随即会打开,并显示为报告添加数据面板。
 将数据添加到报告
数据源用于连接到您的数据,并允许您配置可在报告中使用的字段。
创建新报告时,系统会打开为报告添加数据面板。您可以在此面板中创建新数据源或添加现有数据源。
创建新的数据源
例如,您可能需要连接到 BigQuery 公共数据集(如需完成此步骤,您需要拥有与有效的 Google Cloud 结算账号相关联的 Google Cloud 项目)。
如需创建新的 BigQuery 数据源,请按照以下步骤操作:
- 在向报告添加数据面板中,点击连接到数据。
- 选择 BigQuery 连接器。
- 如果系统提示,请点击授权,以允许 Looker Studio 代表您访问您的数据。
- 选择公共数据集。
- 选择您的结算项目。
- 选择 faa 公共数据集。
- 选择 us_airports 表。
- 点击屏幕右下角的添加,然后确认您要将新数据源添加到报告中。
- 系统会显示报告编辑器,并在画布上放置一个包含数据源中字段的表格。
- 如需自定义表格的数据和样式,请使用屏幕右侧的属性面板。
- 如需重命名报告,请点击屏幕左上角的未命名报告,然后输入新名称。
连接到现有数据源
例如,您可能需要连接到 Looker Studio 随附的 Google Analytics 示例数据源。
如需连接到现有的 Google Analytics 数据集,请按以下步骤操作:
- 在将数据添加到报告面板中,点击我的数据源。
- 选择 Sample Google Analytics Data 数据源。
- 点击屏幕右下角的添加,然后确认您要将新数据源添加到报告中。
- 系统会显示报告编辑器,并在画布上放置一个包含数据源中字段的表格。
- 如需自定义表格的数据和样式,请使用屏幕右侧的属性面板。
- 如需重命名报告,请点击屏幕左上角的未命名报告,然后输入新名称。
 向报告中添加图表和控件
如需向报告画布添加组件,请按以下步骤操作:
- 在编辑器顶部的工具栏中,点击添加图表,然后从列表中选择一个图表。
- 点击画布上想要显示图表的位置。
- 根据需要移动图表并调整其大小。
- 如需添加或更改维度和指标,请点击“属性”面板中的字段,或将字段从“数据”面板(位于图表面板右侧)直接拖放到图表上。
- 您还可以通过将数据面板中的字段拖到画布上来创建新图表。
 查看报告
查看报告
查看报告在其他观看者眼中的显示效果。
在查看模式下,用户可以查看数据并使用您放置在报告中的任何互动控件,但无法更改报告的结构。如果您可以修改报告,则可以在查看模式和修改模式之间切换。
如需从修改模式进入查看模式,请点击 ![]() 查看。
查看。
如需从查看模式返回到修改模式,请点击 ![]() 修改。
修改。
 分享报告
分享报告
与其他查看者共享报告。与其他编辑者协作。
如需与用户共享报告,请按以下步骤操作:
- 点击右上角的
 共享。
共享。 - 指定要与哪些用户或群组共享报告。
- 使用高级选项可更改个别地址访问报告的方式。
 共享数据源
共享数据源
允许其他人根据您的数据源创建自己的报告。
如需共享数据源,您必须直接从数据源页面(而不是通过报告)访问该数据源。您必须登录 Google 账号才能查看或修改数据源。
如需共享数据源,请按以下步骤操作:
- 在报告的左上角,点击
 Looker Studio 徽标,返回到 Looker Studio 首页。
 - 点击左侧的数据源。
- 找到要分享的数据源。
- 点击右侧的
 更多选项。
更多选项。 - 点击 共享。
- 指定要与哪些用户或群组共享数据源。
- 使用高级选项可更改个别收件人访问数据源的方式。
主要概念
下面简要回顾一下本页和整个 Looker Studio 文档中使用的术语和概念。
| 概念 | 功能 |
|---|---|
| 报告 | 一种 Looker Studio 资源,包含一组 网页,旨在向观看者展示从您的数据中提取的信息和数据分析结果。 详细了解 报告。 |
| 组件 | 您添加到报告中用于显示数据的 widget,例如图表、表格以及互动式日期范围控件和过滤条件控件。数据组件从 数据源获取信息。 您还可以使用文字、形状、图片和 嵌入式内容 组件为报告添加注释。 |
| 连接器 / 数据源 |
在 Looker Studio 中,连接到数据涉及以下组件:
详细了解如何 连接到数据。 |
| 字段 | 一列数据。 Looker Studio 使用两种基本类型的字段:
详细了解 报告中的字段。 |
| 凭据 | 数据源确定谁可以查看其提供的数据的机制。 详细了解 数据源凭据。 |
| 查看模式 / 编辑模式 |
|
| 共享和访问权限 | 共享报告和数据源时,您可以决定其他人如何访问相应资源:
借助高级共享选项,您可以控制素材资源访问权限的其他方面,例如下载数据或打印报告的权限。 借助链接共享选项,您可以在互联网上更广泛地分享自己的资产。 详细了解分享。 |