This page provides information intended for existing Apigee customers who want to use Application Integration with the same Google Cloud project.
Overview
All Apigee subscription users who had enabled the Apigee Integrations add-on, will now be redirected to Application Integration at no additional cost. Application Integration is set up for you, and all your existing integrations in Apigee were automatically synchronized and available to use. This means that you can continue to use your existing Google Cloud project for Application Integration without any additional configurations.
To know more about Application Integration, see Application Integration overview.
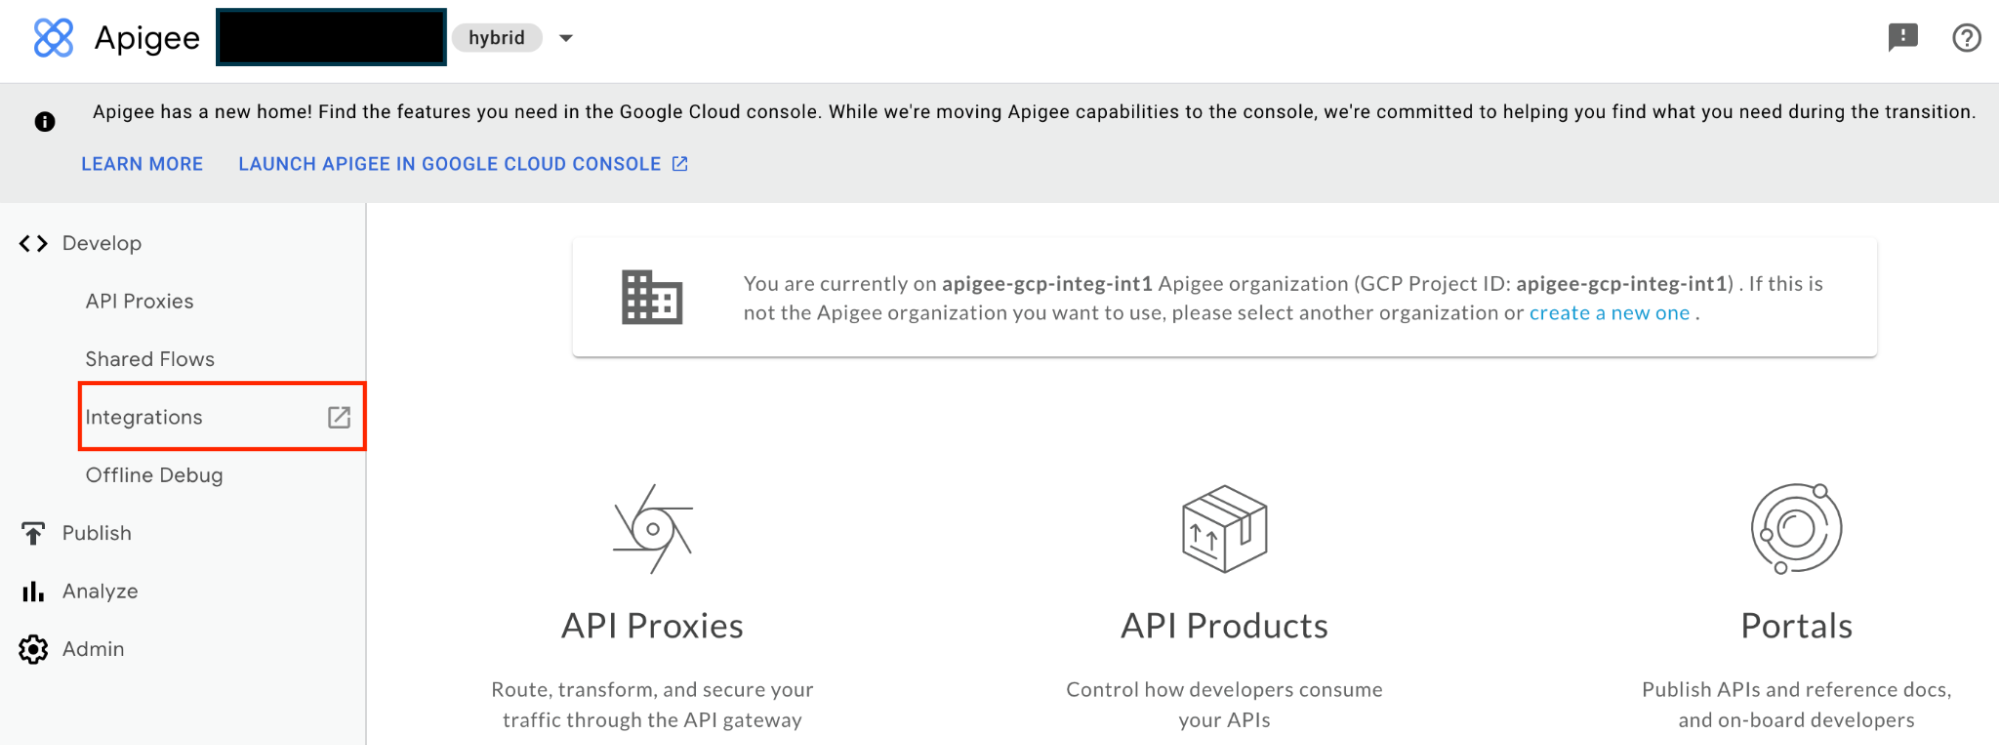
From the Apigee portal, you will be redirected to Application Integration:
What has changed?
The following table provides a summary of the expected differences or changes in your Google Cloud project:
| Apigee resource/feature | Changes |
|---|---|
| IAM permissions | Integrations now use the predefined Application Integration IAM roles. |
| Service account | A new default service account is created that is used for all integrations. |
| REST APIs | Use Application Integration REST API. See REST API changes. |
| Send Email task and Approval task | The sender email address is changed for all outgoing emails. |
IAM permission changes
All existing user accounts or principals are granted with equivalent Predefined Application Integration IAM permissions.
Application Integration IAM permissions have the following format:
Format
integrations.integrationRESOURCE.ACTION
Example
integrations.integrationVersions.get
Custom IAM role limitations
The following limitations apply if you have defined custom IAM roles in your Google Cloud project:
- Apigee proxies using a service account with custom IAM roles containing Apigee Integration permissions might fail. We recommend that you update your custom IAM roles with the Application Integration IAM permissions.
For information about IAM roles and permissions, see Access control overview.
Service account changes
A new default service account with the Application Integration Service Agent (roles/integrations.serviceAgent) IAM role is created in your Google Cloud project.
The new Application Integration default service account is used for the following integration operations:
- To run an integration.
- To invoke a Cloud Function using the Cloud Function task.
- To call an Integration Connector using the Connectors task.
- To create service account tokens for Service account type authentication profiles.
- To encrypt and decrypt Cloud KMS keys for authentication profiles.
Application Integration default service account has the following email address:
Format
service-PROJECT_NUMBER@gcp-sa-integrations.iam.gserviceaccount.com
Example
service-46733320069@gcp-sa-integrations.iam.gserviceaccount.com
For information about service accounts, see Access control overview.
REST API changes
In general, most of the Apigee Integration APIs have their respective Application Integration API equivalents.
The following table describes the key change in the REST APIs of Application Integration when compared to Application Integration:
| Apigee Integration (including Apigee proxy) | Application Integration | |
|---|---|---|
| REST Resource | projects/PROJECT_ID/locations/REGION/products/apigee/integration/INTEGRATION_NAME
|
projects/PROJECT_ID/locations/REGION/integration/INTEGRATION_NAME
|
For information about Application Integration APIs, see Application Integration REST API.
Integration task changes
The Send Email task and the Approval task will use noreply-application-integration@google.com to send email notifications. In addition, all the approval request emails sent using the Approval task will link to Application Integration.