このページは Apigee と Apigee ハイブリッドに適用されます。
Apigee Edge のドキュメントを表示する。

このダッシュボードの内容
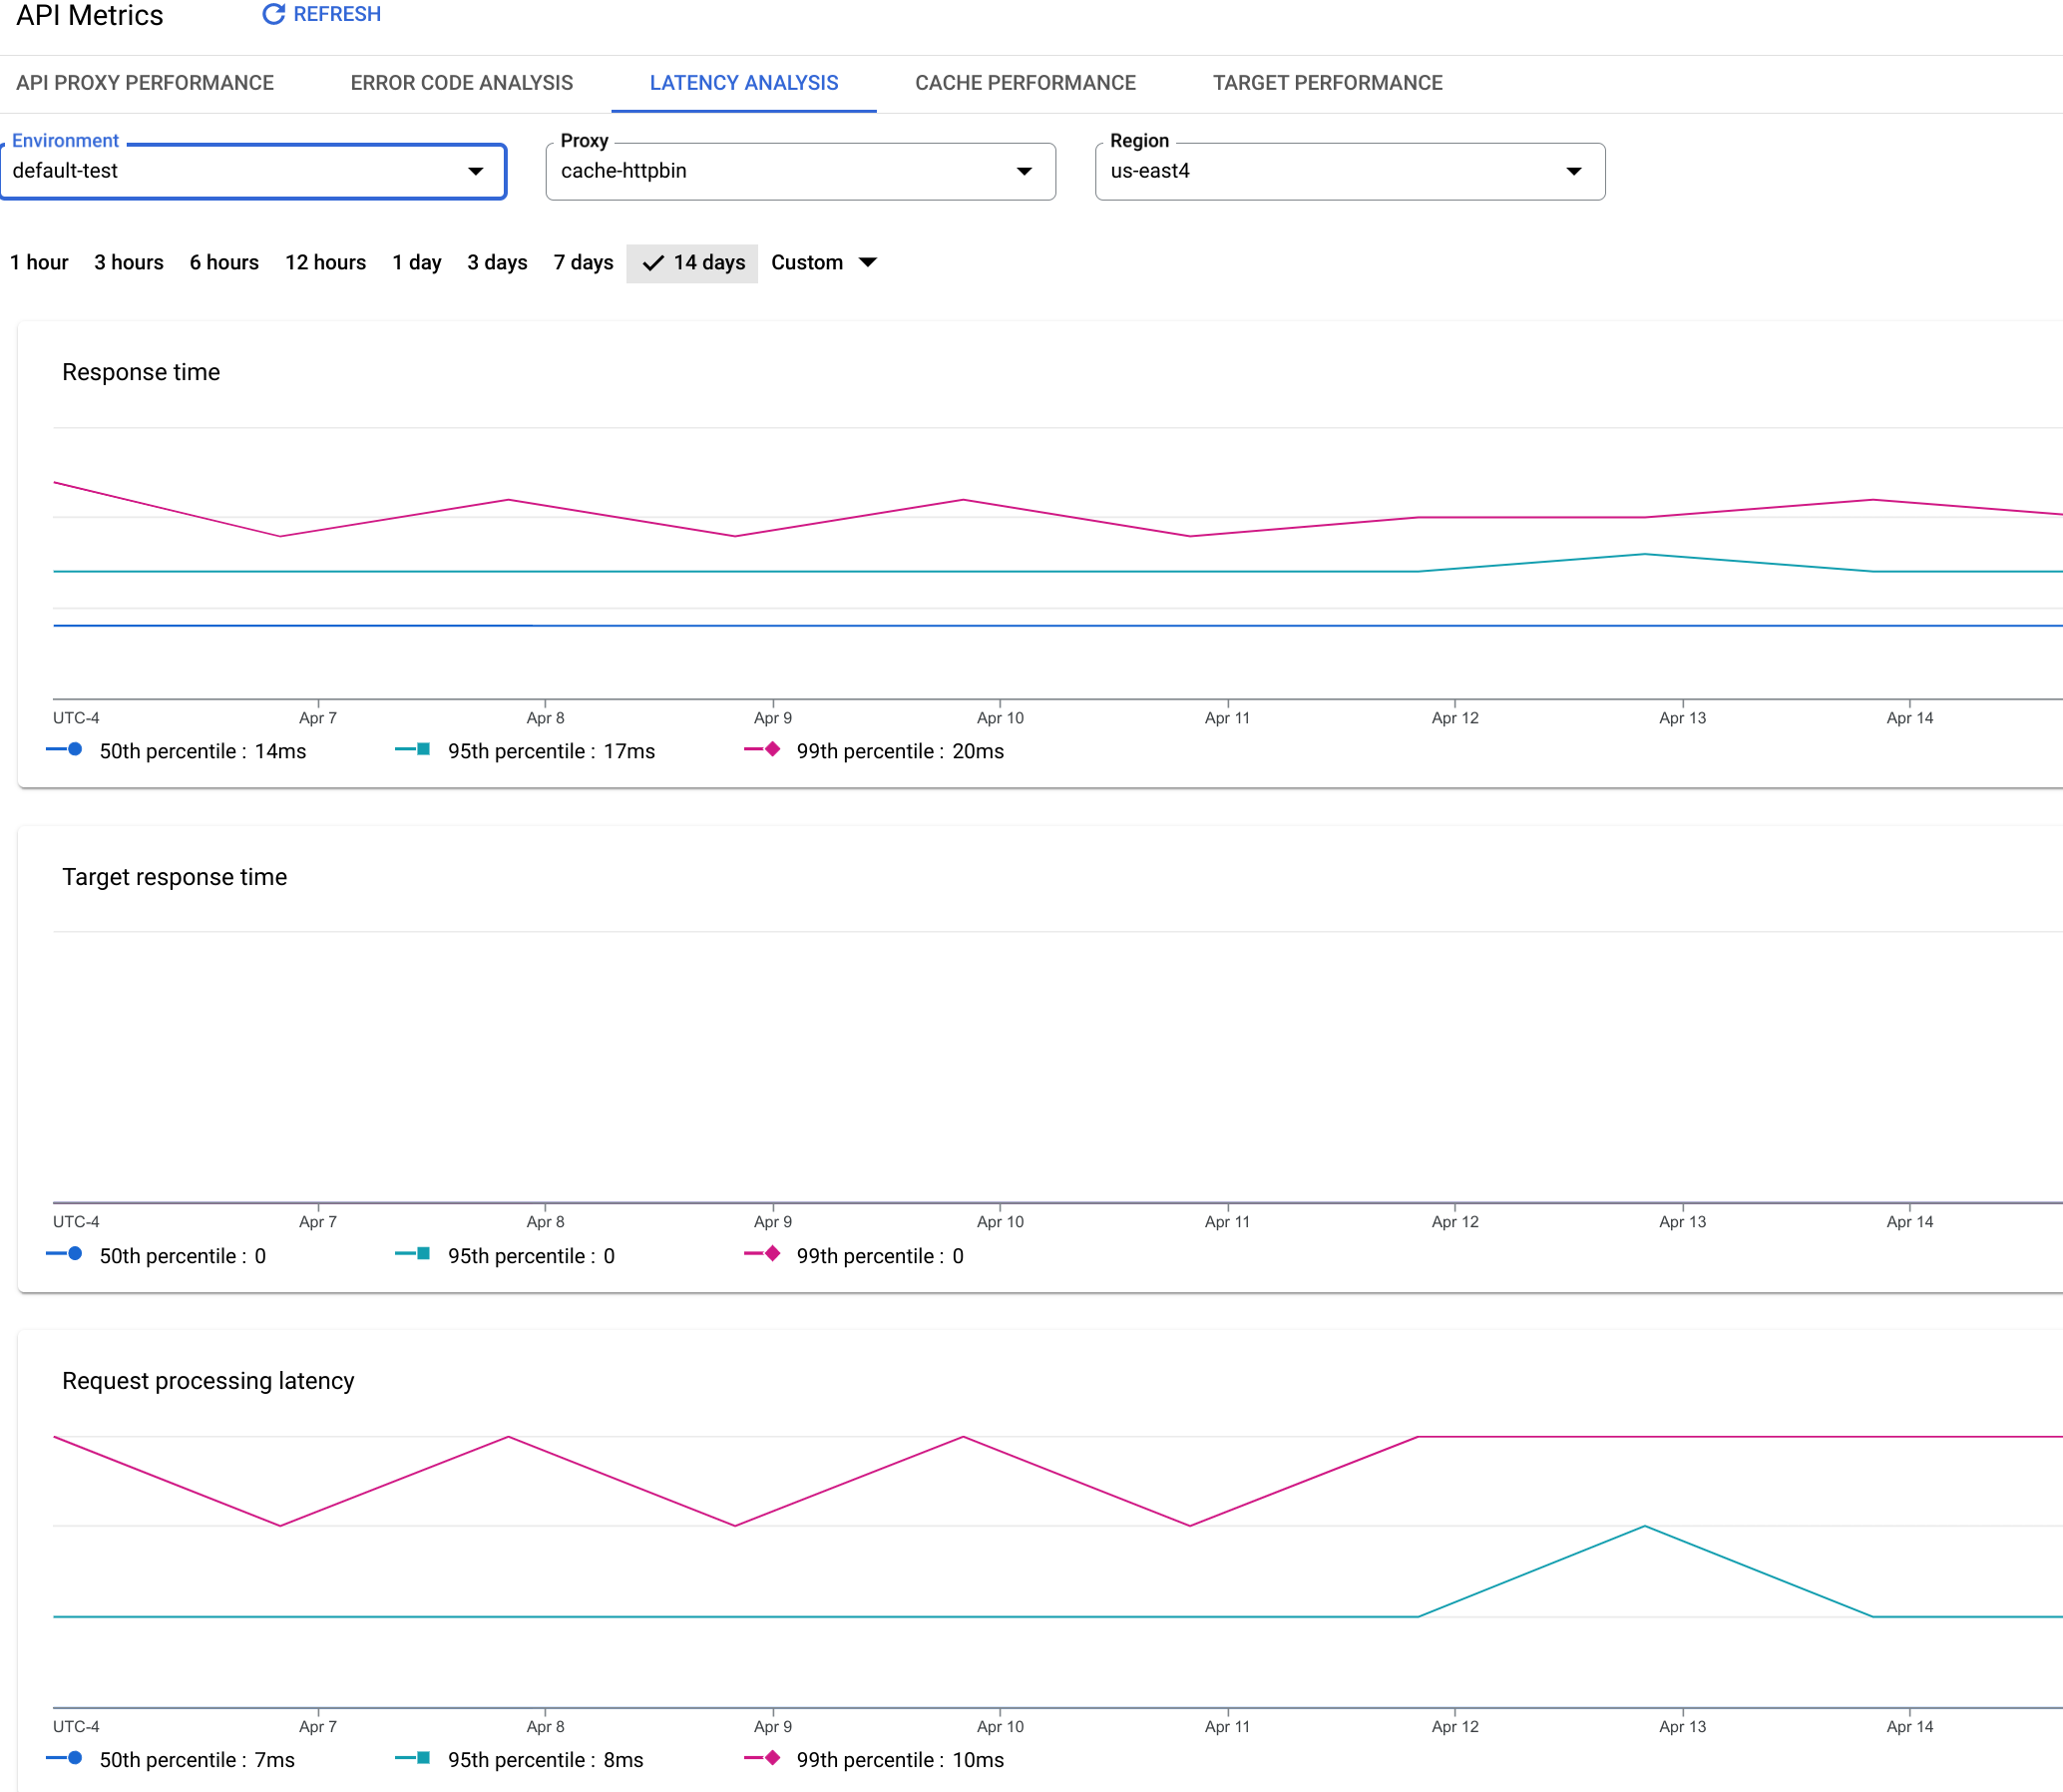
[Latency Analysis] ダッシュボードでは、API プロキシでレイテンシの問題が発生している可能性がある場合に通知できます。レイテンシ測定値が 1 分の時間枠まで表示され、中央値、95 パーセンタイル値、99 パーセンタイル値がハイライト表示されます。
中央値は、トラフィックの半分でこの値未満のレイテンシが発生し、トラフィックの半分でこの値を超えるレイテンシが発生している点を示しています。たとえば、選択した API プロキシのレスポンス時間のレイテンシの中央値が 62 ミリ秒である場合、その API プロキシからのレスポンスの半分のレイテンシが 62 ミリ秒未満であり、その API プロキシからのレスポンスの半分のレイテンシが 62 ミリ秒を超えていることを意味します。
95 パーセンタイル値と 99 パーセンタイル値は、この値未満のレイテンシが発生しているトラフィックがそれぞれ 95% と 99% である点を示しています。さらに重要なことは、トラフィックの 5% と 1% で範囲外のレイテンシ値が発生していることを示していて、それらの値が異常な動作を指摘している可能性があることです。
レイテンシ分析ダッシュボード
レイテンシ分析ダッシュボードにアクセスするには:
Google Cloud コンソールで、[アナリティクス] > [API 指標] > [レイテンシ分析] ページに移動します。
[レイテンシ分析] ビューが表示されます。
このダッシュボードの測定内容
Apigee コミュニティ サイトに、どのような場合に平均合計レスポンス時間が平均ターゲット レスポンス時間を下回るか?という興味深い記事があります。こちらもご覧ください。
| 指標 | 説明 |
|---|---|
| Response Time | 呼び出しに応答するのにかかった時間(ミリ秒)の合計。この時間には、Apigee API プロキシのオーバーヘッドとターゲット サーバーでの時間が含まれています。 |
| Target Response Time | ターゲット サーバーが呼び出しに応答するのにかかった時間(ミリ秒)。この数値はサーバーがどのように動作しているかを示します。 |
| Request Processing Latency |
選択した API プロキシに呼び出しが届いた時点から、Apigee がその呼び出しをターゲット サーバーに送信した時点までの時間(ミリ秒)。 API プロキシでのその呼び出しの最終的なオーバーヘッドを計算するには、リクエストとレスポンスのレイテンシを追加します。 |
| Response Processing Latency |
ターゲット サーバーからのレスポンスを API プロキシが受け取った時点から、Apigee がその呼び出し元に対してレスポンスを送信した時点までの時間(ミリ秒)。 API プロキシでのその呼び出しの最終的なオーバーヘッドを計算するには、リクエストとレスポンスのレイテンシを追加します。 |