Gemini Enterprise provides Cloud Logging for customers to monitor errors and warnings when importing documents or working with data connectors.
This document describes how to access Cloud Logging for Gemini Enterprise using Logs Explorer.
Before you begin
To access Cloud Logging, make sure that your project administrator has
granted you the Logs Viewer IAM role (roles/logging.viewer).
Access Gemini Enterprise logs using Logs Explorer
To access Gemini Enterprise logs, do the following:
- In the Google Cloud console, go to the Logs Explorer.
- Select a Google Cloud project to check its logs.
By default, the Logs Explorer page searches the resources listed in the default log scope for log entries. To filter to Gemini Enterprise logs, do one of the following:
- Select All Resources > Consumed API > Discovery Engine API, and then click Apply.
Enter the following into the query bar, and click Run Query:
resource.type="consumed_api"
resource.labels.service="discoveryengine.googleapis.com"
Further query the logs using the filters provided. For example, change the time range. By default, the Logs Explorer only shows logs from the past hour.
Refine your query scope by filtering on JSON metadata. For example, to query
ImportDocumentsmethod logs, do one of the following:Enter the following into the query bar:
jsonPayload.context.reportLocation.functionName=~"ImportDocuments"Expand the JSON metadata, and click to filter:
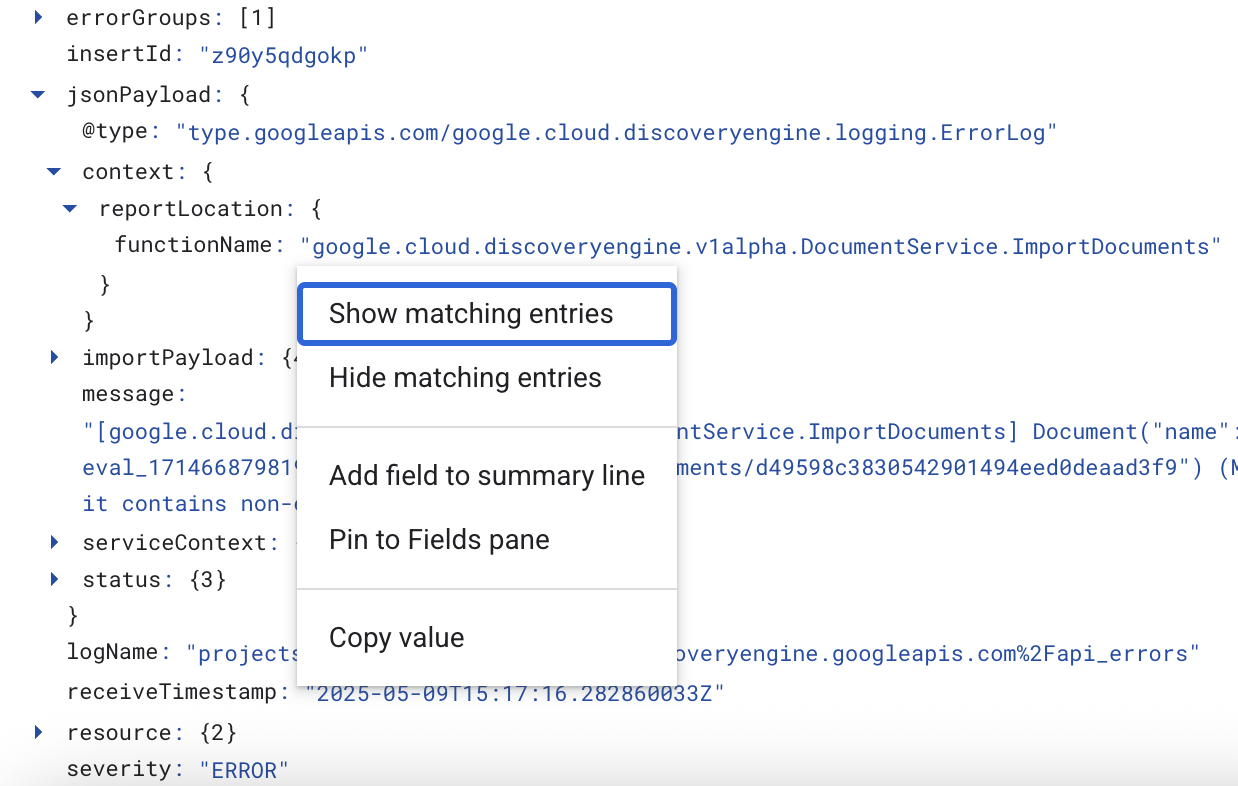
Figure 1. Filter by clicking on JSON metadata
For most warnings and errors, find details in
jsonPayload.messageandjsonPayload.status.For deeper log analysis, dump the logs to a long sink such as BigQuery. For information, see Route logs to supported destinations in the Google Cloud Observability documentation.