Analytics give you insight into the usage trends, search quality, and end-user engagement of your app. The console provides an interactive dashboard experience powered by Looker. This page describes how to view analytics for your apps.
Before you begin
Ensure your app is connected to a data store. App metrics are only available from the time a data store is linked to an app.
If you don't have a data store, you need to connect a Google data source or a third-party data source to your app.
User events for analytics
This section describes the user events Gemini Enterprise uses to generate the search-related metrics, such as search count and click-through-rate. No additional configurations are needed if you are using the user interface to search and get answers through the Gemini Enterprise assistant. However, if you use the Gemini Enterprise APIs in your own apps, you must configure the search in your app to capture the user events and then import user events to your app..
Gemini Enterprise apps require the following user events to get the metrics:
- Search events. Required for click-through-rate.
- View-item events. Required for click-through-rate.
The following information is also used for some analytics:
- Impressions. You can provide impressions (item views or clicks)
that are attributable to Google by including the associated item
in
UserEvent.Documentswhen ingesting user events. This information is needed for attribution and to compute per-search metrics. - Attribution tokens. Attribution tokens are unique IDs generated by
Google and returned with each search request. Make sure to
include that attribution token as
UserEvent.attributionTokenwith any user events resulting from a search. This is needed to identify if a search is served by the API. Only user events with a Google-generated attribution token are used to compute metrics. - Search logs. Search logs are based on search requests. To allow Google
to identify user sessions so that it can deliver per-session analytics and
higher quality search results, Google strongly recommends that you set the
optional field
SearchRequest.UserPseudoId.
If there are no search logs or user events, default values are shown for all metrics.
View Gemini Enterprise analytics
You can view search analytics for your app. You see the metrics related to
the search calls made to your app. If your app is connected to multiple data
stores, then making search calls to the app by specifying the engine resource
is recommended so that you can get results from across all its connected data
stores.
Use the following instructions to view analytics about your app.
In the Google Cloud console, go to the Gemini Enterprise page.
Click the name of the app that you want to view analytics for.
Click Analytics.
Click a tab to view that metric group:
- Adoption: Metrics on user adoption status.
- Usage and Quality: Metrics on user feedback and app usage.
- Agent: Metrics related to in-app agents, such as deep research, idea forge, and custom agents.
- Value: Metrics on cost savings achieved by users querying data with the app.
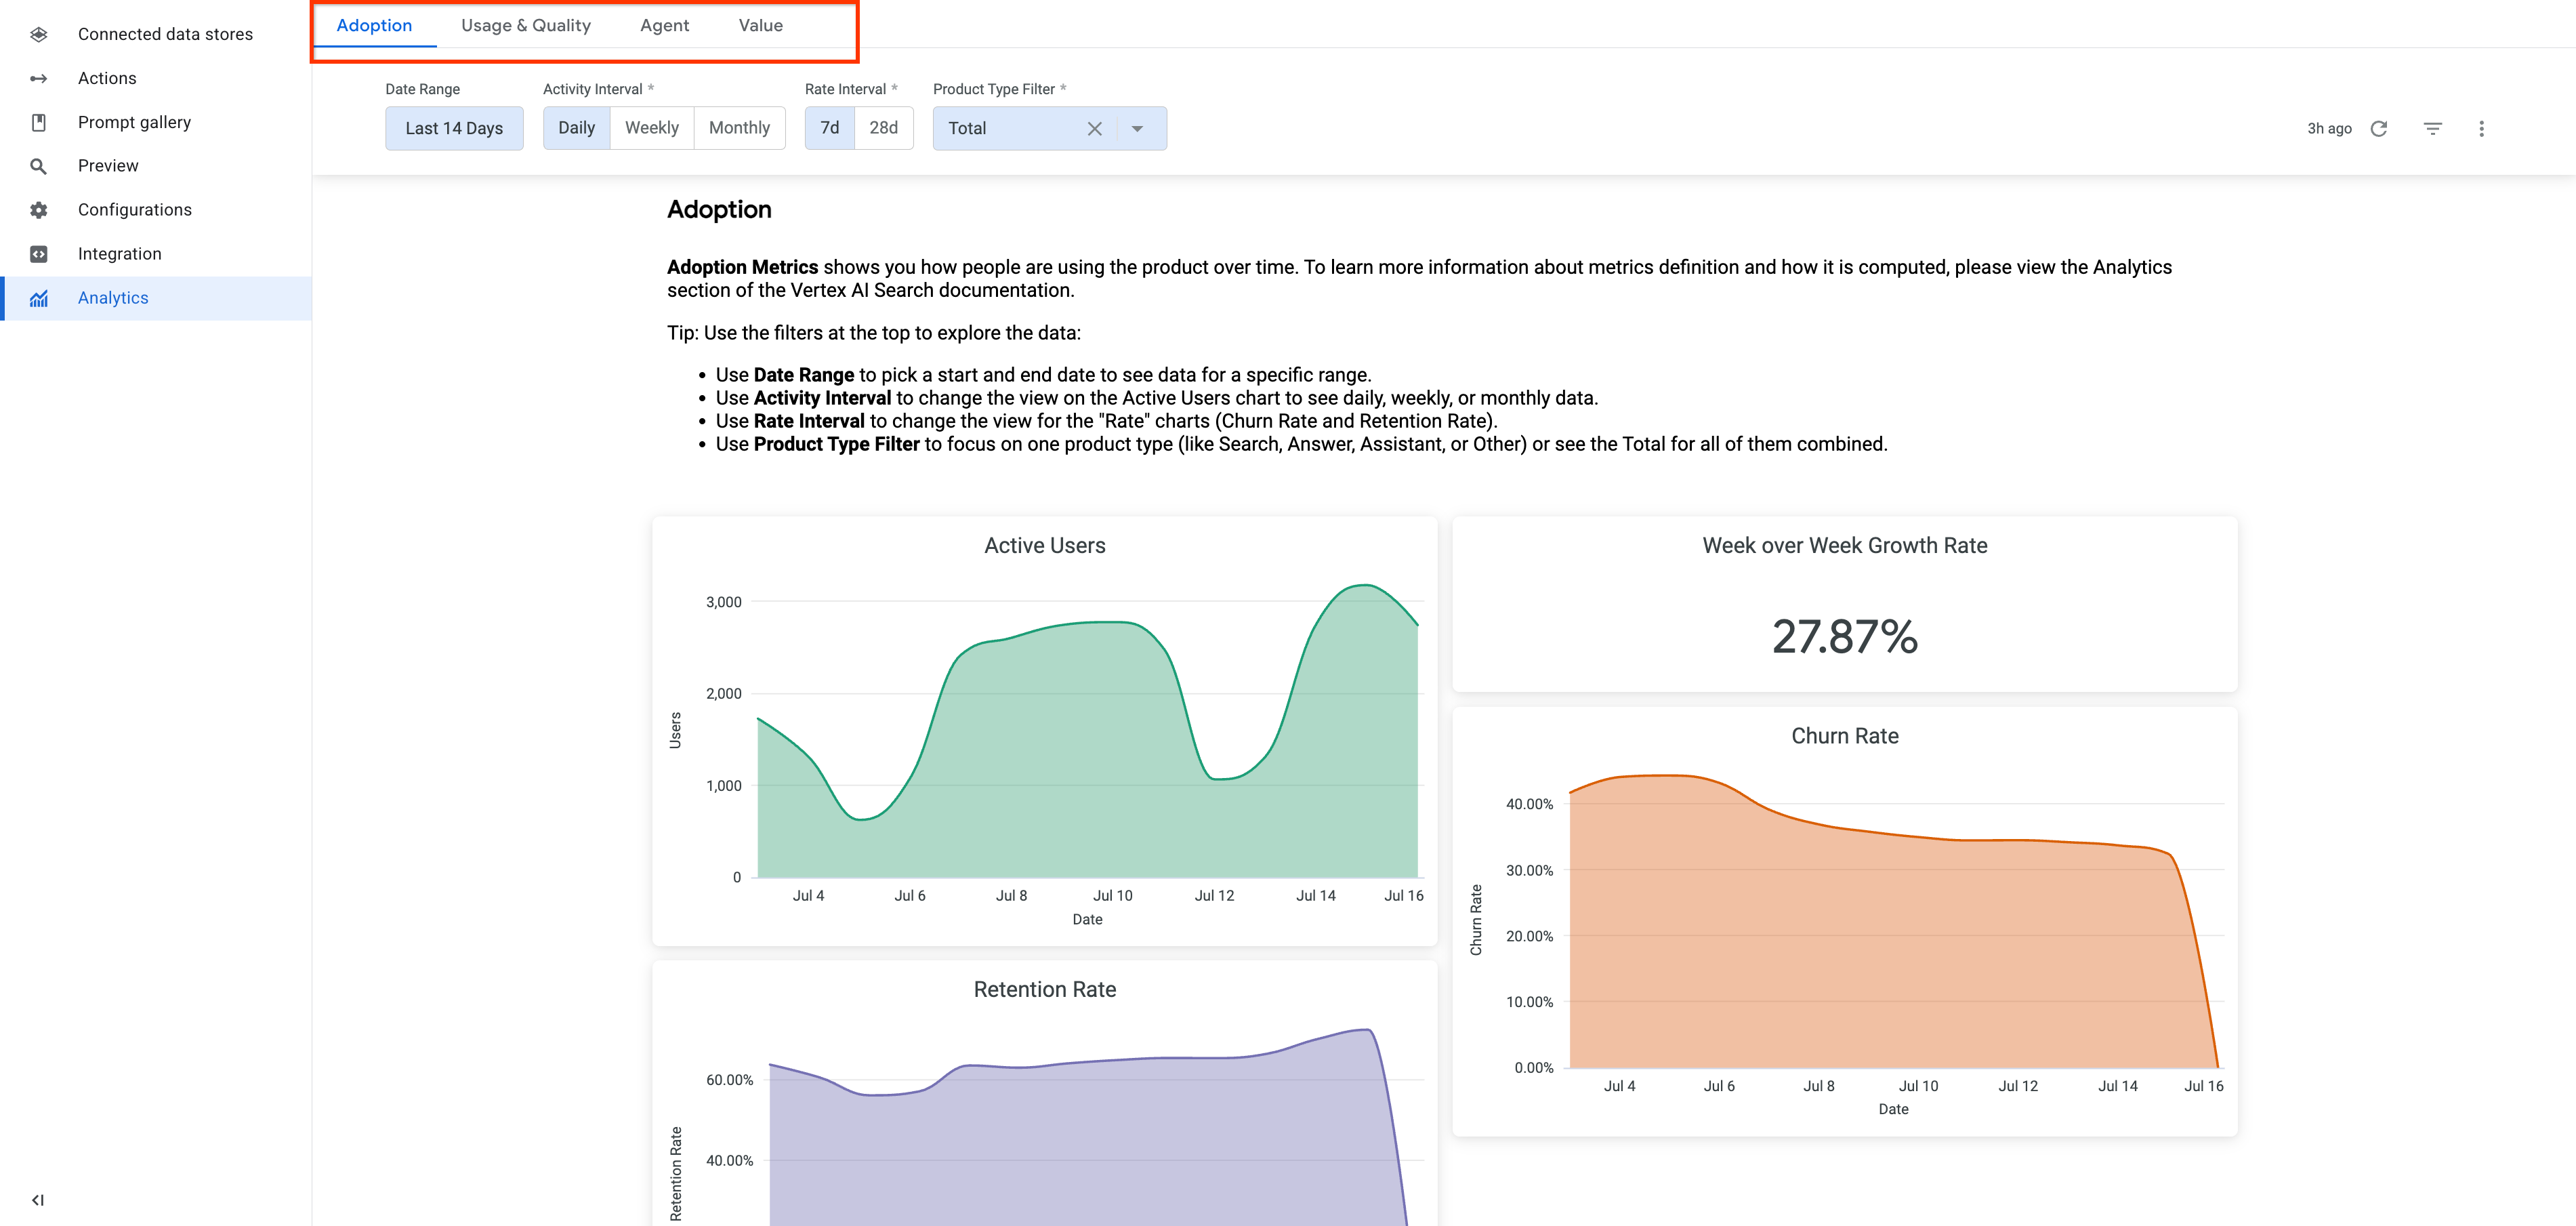
See the analytics data for adoption To filter your metrics, specify the filters available for the metric tab and then click the Refresh button to apply them.
Metrics definitions
The following table describes how metrics are defined.
| Metric group | Metric name | Metric definition | Notes |
|---|---|---|---|
| Adoption | Daily active users | Count of active users per day | A user is considered active if they sign in and trigger any API calls, such as when landing on the home page. |
| Weekly active users | Count of active users per week. The week starts on Monday and ends on Sunday. | ||
| Monthly active users | Count of active users per month | ||
| 7d retention rate | Count of returned user in the current 7-day period / count of active user in the previous 7-day period | A user is considered as a returned user if the user is active during the current 7-day period and the previous 7-day period. | |
| 7d growth rate | The percentage difference between the number of active users in the current seven-day period and the previous seven-day period | ||
| 7d churn rate | Count of churned users in the current 7-day period / count of active user in the previous 7-day period | A user is considered churned if the user was active in the previous 7-day period, but is not active in the current 7-day period. | |
| 28d retention rate | Count of returned user in the current 28-day period / count of active user in the previous 28-day period | ||
| 28d growth rate | The percentage difference between the number of active users in the current 28-day period and the previous 28-day period | ||
| 28d churn rate | Count of churned users in the current 28-day period / count of active users in the previous 28-day period | ||
| Seats purchased | The number of licenses (seats) the organization has purchased | Includes all seats purchased since registering with Gemini Enterprise. | |
| Seats claimed | The number of user licenses that have been assigned to and accepted by individuals within your organization | Includes all seats claimed since registering with Gemini Enterprise. | |
| Usage and quality | Search count | Total number of search | |
| Answer count | Total number of query where Gemini Enterprise has generated an answer | Answers generated by an agent are not included in this count. | |
| Action count | Total number of query answered by Gemini Enterprise | Includes actions such as creating an email template. | |
| Click-through rate (CTR) per search | Total number of search clicks / search count | Search clicks include clicks on search results and internal references. | |
| Page view per category | Total number of view for each category page | ||
| Feedback like and dislike count | Count of likes and dislikes sent by users | A record of the thumbs-up/thumbs-down feedback responses sent by the app's users. | |
| Feedback dislike reasons breakdown | Percentage of the dislike reasons | When a user dislikes a generated answer, they can select multiple reasons to explain their dislike. The percentage shows how often each reason was selected. | |
| Successful search rate | Successful search count / search count | ||
| Successful answer rate | Successful answer count / answer count | ||
| Agents | Monthly active agent users | Total number of active users who used the agent in the last calendar month. | |
| Monthly agent chat sessions | Total number of chat sessions initiated by the users interacting with a specific agent during the last calendar month. | A chat session is defined as a user interacting with an agent within the same chat thread on a single day. If the user continues the conversation in the same chat thread on a subsequent day, it will be considered a new session. | |
| Monthly agents used | Total number of agents that had at least one active user during the last calendar month. | ||
| Monthly total chat sessions | Total number of chat sessions initiated by the users interacting with the agents during the last calendar month. | A chat session is defined as a user interacting with an agent within the same chat thread on a single day. If the user continues the conversation in the same chat thread on a subsequent day, it will be considered a new session. | |
| Monthly agents created | Total number of Agents that were created in the last calendar month. | ||
| Value (public preview) |
|||
| Successful search | Count of successful searches. |
The number of successful searches are determined by the user behavior after
a search. A search is considered successful if one of the following occurs:
|
|
| Successful answer | Count of successful answers |
An answer's success is determined by user behavior after it is generated.
Success is measured by feedback provided or how soon a follow up question
was asked.
|
|
| Employee hours saved for selected dates | (Successful search count + Successful answer count) x Minutes saved per successful answer | ||
| Value saved for selected dates | Hours saved within the dates selected ✕ Average employee hourly rate | To view this metric, in the Value tab, specify an hourly rate for the Employee Hourly Rate field. | |
| Projected annual employee hours saved | (Successful search count + Successful answer count) x Minutes saved per successful search | The projected annual successful search count is derived from the successful search count within the chosen date range. Each query is estimated to save three minutes, an estimate based on Google's internal research. | |
| Projected annual value saved | Projected annual employee hours saved ✕ Average employee hourly rate | To view this metric, in the Value tab, specify an hourly rate for the Employee Hourly Rate field. |
Export metrics
Follow these steps to export the metrics to a BigQuery table in your Google Cloud project:
Verify that you have the required permissions and roles.
- You need to have the Discovery Engine Viewer role to be able to call the API.
- Required permissions to create a BigQuery dataset
- Required permissions to create a table.
Create a BigQuery dataset:
Open the BigQuery page in the Google Cloud console.
In the Explorer panel, select the same project that your Gemini Enterprise app is in to create the dataset.
Click the option and click Create dataset.
On the Create dataset page:
For Dataset ID, enter a unique dataset name. You need the dataset name to export the metrics through the API.
For Location type, the following table shows you how to map the BigQuery locations to the Gemini Enterprise app locations:
Gemini Enterprise app multi-region location BigQuery multi-region location Global US (multiple regions in United States) US (multiple regions in United States) US (multiple regions in United States) EU (multiple regions in the Europe Union) EU (multiple regions in the Europe Union)
Click Create dataset.
Create an empty BigQuery table for the dataset you created.
- In the Explorer panel, expand your project, and then select the dataset you created.
- In the Dataset info section, click Create table.
- In the Create table panel, specify a name for your table in the Table field. You need the table name to export the metrics through the API.
- Click Create table.
Call the
analytics:exportMetricsmethod to retrieve metrics data for the past 30 days, which includes the current day.REST
curl -X POST \
-H "Authorization: Bearer $(gcloud auth print-access-token)" \
-H "Content-Type: application/json" \
-H "X-Goog-User-Project: PROJECT_ID" \
-d '{
   "analytics": "projects/PROJECT_ID/locations/LOCATION/collections/default_collection/engines/APP_ID",
   "outputConfig":
      {
         "bigqueryDestination":
         {
            "datasetId": "BIGQUERY_DATASET_ID",
            "tableId": "BIGQUERY_TABLE_ID"
         }
      }
   }' \
"https://ENDPOINT_LOCATION-discoveryengine.googleapis.com/v1alpha/projects/PROJECT_ID/locations/LOCATION/collections/default_collection/engines/APP_ID/analytics:exportMetrics"
Replace the following:
ENDPOINT_LOCATION: the multi-region for your API request. Assign one of the following values:us-for the US multi-regioneu-for the EU multi-regionglobal-for the Global location
LOCATION: the multi-region of your data store:global,us, oreuPROJECT_ID: the ID of your Google Cloud project.APP_ID: the ID of the app that you want to export metrics from.BIGQUERY_DATASET_ID: the ID of the BigQuery dataset you created.
The dataset ID follows the<PROJECT_ID>.<DATASET_ID>format. You only need to provide the<DATASET_ID>.BIGQUERY_TABLE_ID: the ID of the BigQuery table you created.
In the Classic explorer view, the table ID follows the<PROJECT_ID>.<DATASET_ID>.<TABLE_ID>format. You only need to provide the<TABLE_ID>.
The response includes the operation name and ID. Note the operation ID to use in the next step.
For example:{ "name": "projects/my-project-123/locations/global/collections/default_collection/engines/my-app/operations/OPERATION_ID", "metadata": { "@type": "type.googleapis.com/google.cloud.discoveryengine.v1alpha.ExportMetricsMetadata" } }To see the status of the export metrics operation, call the
engines.operations.getmethod:REST
curl -X GET \
-H "Authorization: Bearer $(gcloud auth print-access-token)" \
"https://ENDPOINT_LOCATION-discoveryengine.googleapis.com/v1alpha/projects/PROJECT_ID/locations/LOCATION/collections/default_collection/engines/APP_ID/operations/OPERATION_ID"
Replace the following:
ENDPOINT_LOCATION: the multi-region for your API request. Assign one of the following values:us-for the US multi-regioneu-for the EU multi-regionglobal-for the Global location
LOCATION: the multi-region of your data store:global,us, oreuAPP_ID: the ID of the app that you want to get the long running operations of.OPERATION_ID: the ID of the export metrics operation that was returned in the response when you ran the command to export the metrics.