Mulai 29 April 2025, model Gemini 1.5 Pro dan Gemini 1.5 Flash tidak tersedia di project yang belum pernah menggunakan model ini, termasuk project baru. Untuk mengetahui detailnya, lihat Versi dan siklus proses model.
Tetap teratur dengan koleksi
Simpan dan kategorikan konten berdasarkan preferensi Anda.
AI Generatif di Vertex AI menyediakan dasbor observasi model bawaan untuk
melihat perilaku, kondisi, dan performa model yang terkelola sepenuhnya.
Model terkelola sepenuhnya, yang juga dikenal sebagai Model sebagai Layanan (MaaS), disediakan oleh Google dan mencakup model Gemini Google dan model partner dengan endpoint terkelola. Metrik dari model yang dihosting sendiri tidak disertakan dalam dasbor.
AI Generatif di Vertex AI secara otomatis mengumpulkan dan melaporkan aktivitas dari model MaaS untuk membantu Anda memecahkan masalah latensi dengan cepat dan memantau kapasitas.
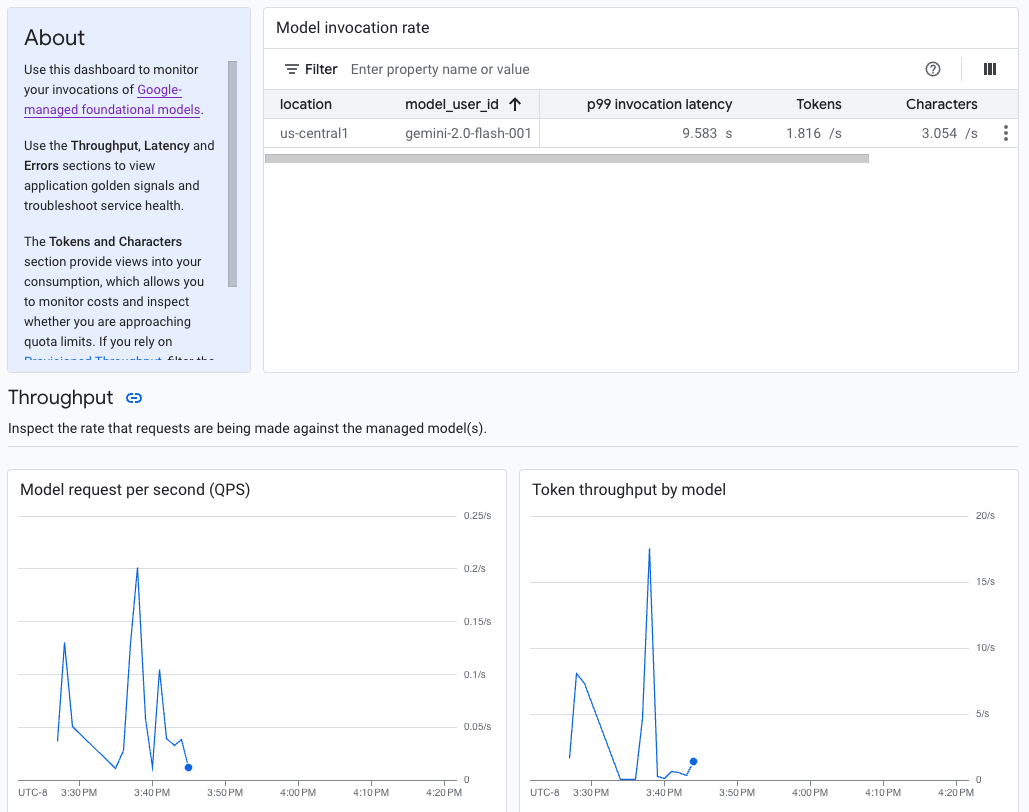
Contoh dasbor kejelasan model
Metrik pemantauan yang tersedia
Dasbor kejelasan model menampilkan subset metrik yang dikumpulkan oleh Cloud Monitoring, seperti permintaan model per detik (QPS), throughput token, dan latensi token pertama. Lihat dasbor untuk melihat semua metrik yang tersedia.
Kasus penggunaan
Sebagai developer aplikasi, Anda dapat melihat cara pengguna berinteraksi dengan model yang telah Anda ekspos. Misalnya, Anda dapat melihat tren penggunaan model (permintaan model per detik) dan intensitas komputasi perintah pengguna (latensi pemanggilan model) dari waktu ke waktu. Oleh karena itu, karena metrik ini terkait dengan penggunaan model, Anda juga dapat memperkirakan biaya untuk menjalankan setiap model.
Jika timbul masalah, Anda dapat memecahkan masalah dengan cepat dari dasbor. Anda dapat memeriksa apakah model merespons dengan andal dan tepat waktu dengan melihat rasio error API, latensi token pertama, dan throughput token.
Batasan
Vertex AI hanya merekam metrik dasbor untuk panggilan API ke endpoint model.Penggunaan konsol, seperti metrik dari Vertex AI Studio, tidak ditambahkan ke dasbor. Google Cloud
Melihat dasbor
Di bagian Vertex AI pada Google Cloud konsol, buka halaman
Dasbor.
[[["Mudah dipahami","easyToUnderstand","thumb-up"],["Memecahkan masalah saya","solvedMyProblem","thumb-up"],["Lainnya","otherUp","thumb-up"]],[["Sulit dipahami","hardToUnderstand","thumb-down"],["Informasi atau kode contoh salah","incorrectInformationOrSampleCode","thumb-down"],["Informasi/contoh yang saya butuhkan tidak ada","missingTheInformationSamplesINeed","thumb-down"],["Masalah terjemahan","translationIssue","thumb-down"],["Lainnya","otherDown","thumb-down"]],["Terakhir diperbarui pada 2025-08-25 UTC."],[],[],null,["# Monitor models\n\nThis document explains how to monitor the behavior, health, and performance of\nyour fully-managed models in Vertex AI. It describes how to use the prebuilt\nmodel observability dashboard to gain insights into model usage, identify\nlatency issues, and troubleshoot errors.\n\nYou learn how to do the following:\n\n- Access and interpret the model observability dashboard.\n- View available monitoring metrics.\n- Monitor model endpoint traffic using Metrics Explorer.\n\nAccess and interpret the model observability dashboard\n------------------------------------------------------\n\nGenerative AI on Vertex AI provides a prebuilt model observability dashboard to\nview the behavior, health, and performance of fully-managed models.\nFully-managed models, also known as Model as a Service (MaaS), are provided by\nGoogle and include Google's Gemini models and partner\nmodels with managed endpoints. Metrics from self-hosted models aren't included\nin the dashboard.\n\nGenerative AI on Vertex AI automatically collects and reports activity from MaaS\nmodels to help you quickly troubleshoot latency issues and monitor capacity.\n^Model observability dashboard example^\n\n### Use case\n\nAs an application developer, you can view how your users are interacting with\nthe models that you've exposed. For example, you can view how model usage (model\nrequests per second) and the compute intensity of user prompts (model invocation\nlatencies) are trending over time. Consequently, because these metrics are\nrelated to model usage, you can also estimate costs for running each model.\n\nWhen an issue arises, you can quickly troubleshoot from the dashboard. You can\ncheck if models are responding reliably and in a timely manner by viewing API\nerror rates, first token latencies, and token throughput.\n\n### Available monitoring metrics\n\nThe model observability dashboard displays a subset of metrics that are\ncollected by Cloud Monitoring, such as model request per second (QPS), token\nthroughput, and first token latencies. [View the dashboard](#view) to see all\nthe available metrics.\n\n### Limitations\n\nVertex AI captures dashboard metrics only for API calls to a\nmodel's endpoint. Google Cloud console usage, such as metrics from\nVertex AI Studio, aren't added to the dashboard.\n\n### View the dashboard\n\n1. In the Vertex AI section of the Google Cloud console, go to the\n **Dashboard** page.\n\n [Go to Vertex AI](https://console.cloud.google.com/vertex-ai/)\n2. In the **Model observability** section, click **Show all metrics** to view\n the model observability dashboard in the Google Cloud Observability console.\n\n | **Note:** The observability section is available only if you or another user has made API calls to a MaaS model in your project.\n3. To view metrics for a specific model or in a particular location, set one or\n more filters at the top of the dashboard page.\n\n For descriptions of each metric, see the \"`aiplatform`\" section on the\n [Google Cloud metrics](/monitoring/api/metrics_gcp_a_b#gcp-aiplatform) page.\n\nMonitor model endpoint traffic\n------------------------------\n\nUse the following instructions to monitor traffic to your endpoint in the\nMetrics Explorer.\n\n1. In the Google Cloud console, go to the **Metrics Explorer** page.\n\n [Go\n to Metrics Explorer](https://console.cloud.google.com/projectselector/monitoring/metrics-explorer?supportedpurview=project,folder,organizationId)\n2. Select the project you want to view metrics for.\n\n3. From the **Metric** drop-down menu, click **Select a metric**.\n\n4. In the **Filter by resource or metric name** search bar, enter\n `Vertex AI Endpoint`.\n\n5. Select the **Vertex AI Endpoint \\\u003e Prediction** metric category. Under **Active metrics**, select any of the following metrics:\n\n - **`prediction/online/error_count`**\n - **`prediction/online/prediction_count`**\n - **`prediction/online/prediction_latencies`**\n - **`prediction/online/response_count`**\n\n Click **Apply** . To add more than one metric, click **Add query**.\n\n You can filter or aggregate your metrics using the following drop-down menus:\n - To select and view a subset of your data based on specified criteria, use\n the **Filter** drop-down menu. For example, to filter for the model\n `gemini-2.0-flash-001`, use `endpoint_id = gemini-2p0-flash-001` (note that\n the `.` in the model version is replaced with a `p`).\n\n - To combine multiple data points into a single value and see a summarized\n view of your metrics, use the **Aggregation** drop-down menu. For example, you can aggregate the **Sum** of `response_code`.\n\n6. Optionally, you can set up alerts for your endpoint. For more information,\n see [Manage alerting policies](/monitoring/alerts/manage-alerts).\n\nTo view the metrics you add to your project using a dashboard, see\n[Dashboards overview](/monitoring/dashboards).\n\nWhat's next\n-----------\n\n- To learn how to create alerts for your dashboard, see [Alerting overview](/monitoring/alerts).\n- To learn about metrics data retention, see the [Monitoring quotas and limits](/monitoring/quotas#data_retention_policy).\n- To learn about data at rest, see [Protecting data at rest](/monitoring/compliance/data-at-rest).\n- To view a list of all metrics that Cloud Monitoring collects, see the \"`aiplatform`\" section on the [Google Cloud metrics](/monitoring/api/metrics_gcp_a_b#gcp-aiplatform) page."]]