Tetap teratur dengan koleksi
Simpan dan kategorikan konten berdasarkan preferensi Anda.
Linux
Anda dapat melacak metrik seperti penggunaan GPU dan memori GPU dari instance virtual machine (VM) menggunakan Agen Operasional, yang merupakan solusi pengumpulan telemetri yang direkomendasikan Google untuk Compute Engine.
Dengan menggunakan Agen Operasional, Anda dapat mengelola VM GPU sebagai berikut:
Visualisasikan performa fleet GPU NVIDIA Anda dengan dasbor
yang telah dikonfigurasi sebelumnya.
Optimalkan biaya dengan mengidentifikasi GPU yang kurang dimanfaatkan dan menggabungkan workload.
Rencanakan penskalaan dengan melihat tren untuk memutuskan kapan harus memperluas kapasitas GPU atau
mengupgrade GPU yang ada.
Gunakan metrik pembuatan profil NVIDIA Data Center GPU Manager (DCGM) untuk mengidentifikasi
bottleneck dan masalah performa dalam GPU Anda.
Dapatkan pemberitahuan tentang metrik dari GPU NVIDIA Anda.
Dokumen ini membahas prosedur untuk memantau GPU pada VM Linux menggunakan
Agen Operasional. Selain itu, skrip pelaporan tersedia di GitHub yang juga dapat disiapkan untuk memantau penggunaan GPU di VM Linux. Lihat skrip pemantauan compute-gpu-monitoring.
Skrip ini tidak dikelola secara aktif.
Agen Operasional, versi 2.38.0 atau yang lebih baru, dapat otomatis melacak pemanfaatan
GPU dan tingkat penggunaan memori GPU pada VM Linux yang telah menginstal
agen. Metrik ini, yang diperoleh dari NVIDIA Management Library (NVML),
dilacak per GPU dan per proses untuk setiap proses yang menggunakan GPU.
Untuk melihat metrik yang dipantau oleh Agen Operasional,
lihat Metrik agen: gpu.
Anda juga dapat menyiapkan integrasi NVIDIA Data Center GPU Manager (DCGM) dengan
Agen Operasional. Integrasi ini memungkinkan Agen Operasional melacak metrik
menggunakan penghitung hardware di GPU. DCGM menyediakan akses ke
metrik tingkat perangkat GPU. Hal ini termasuk penggunaan blok Streaming Multiprocessor (SM),
jumlah pengguna SM, penggunaan pipa SM, rasio traffic PCIe,
dan rasio traffic NVLink. Untuk melihat metrik yang dipantau oleh Agen Operasional, lihat
Metrik aplikasi pihak ketiga: NVIDIA Data Center GPU Manager (DCGM).
Untuk meninjau metrik GPU dengan menggunakan Agen Operasional, selesaikan langkah-langkah berikut:
Di setiap VM, pastikan Anda telah memenuhi persyaratan.
Sistem operasi dan versi Linux untuk setiap VM Anda harus mendukung Agen Operasional. Lihat daftar
sistem operasi Linux
yang mendukung Agen Operasional.
Pastikan Anda memiliki akses sudo ke setiap VM.
Menginstal Agen Operasional
Untuk menginstal Agen Operasional, selesaikan langkah-langkah berikut:
Jika sebelumnya Anda menggunakan
skrip pemantauan compute-gpu-monitoring
untuk melacak penggunaan GPU, nonaktifkan layanan ini sebelum menginstal Agen Operasional.
Untuk menonaktifkan skrip pemantauan, jalankan perintah berikut:
Opsional: Menyiapkan integrasi NVIDIA Data Center GPU Manager (DCGM)
Agen Operasional juga menyediakan integrasi untuk NVIDIA Data Center GPU Manager
(DCGM) untuk mengumpulkan metrik GPU lanjutan utama seperti penggunaan blok Streaming Multiprocessor (SM),
jumlah pengguna SM, penggunaan pipa SM, rasio traffic PCIe, dan rasio traffic NVLink.
Metrik GPU lanjutan ini tidak dikumpulkan dari model NVIDIA P100 dan P4.
Di kolom Filterfilter_list,
ketik NVIDIA. Dasbor
NVIDIA GPU Monitoring Overview (GCE dan GKE)
akan ditampilkan.
Jika Anda telah menyiapkan integrasi NVIDIA Data Center GPU Manager (DCGM), dasbor
NVIDIA GPU Monitoring Advanced DCGM Metrics (Khusus GCE)
juga akan ditampilkan.
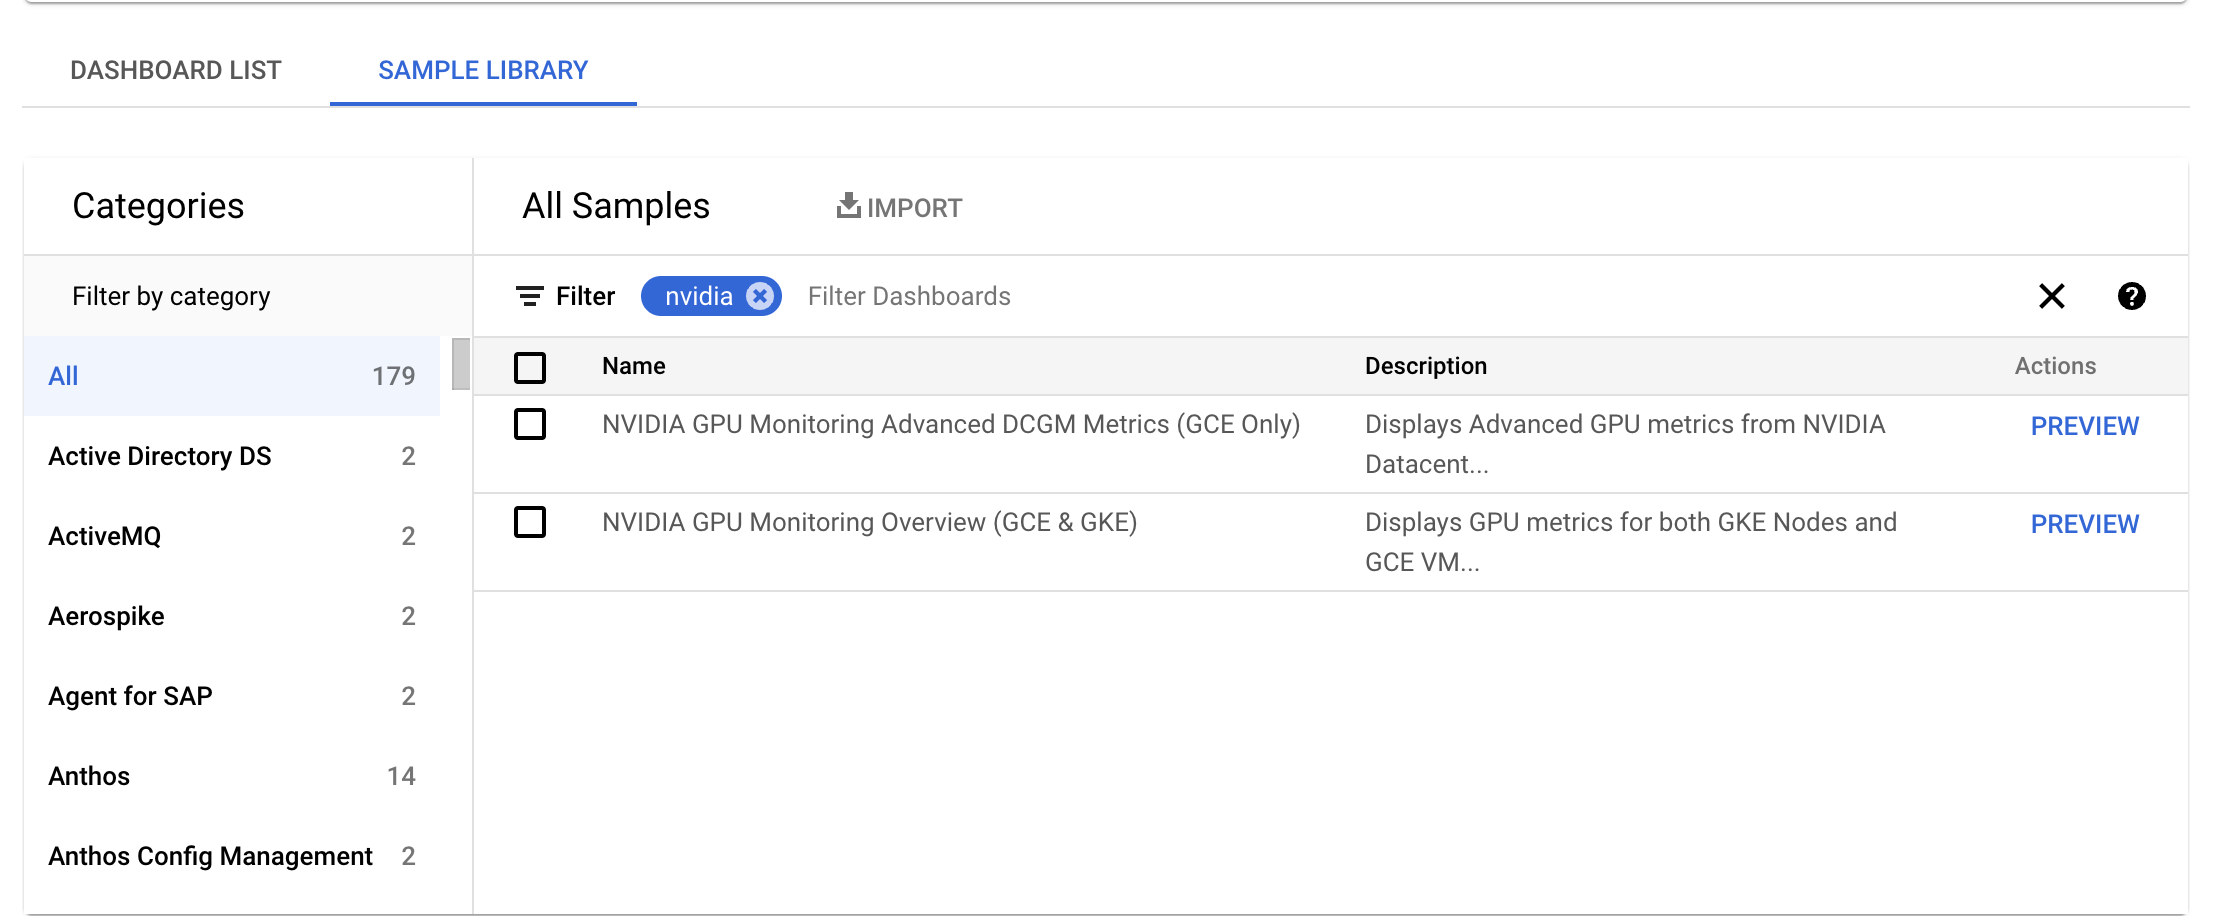
Untuk dasbor yang diperlukan, klik Preview. Halaman Sample dashboard preview akan ditampilkan.
Dari halaman Sample dashboard preview, klik Import sample dashboard.
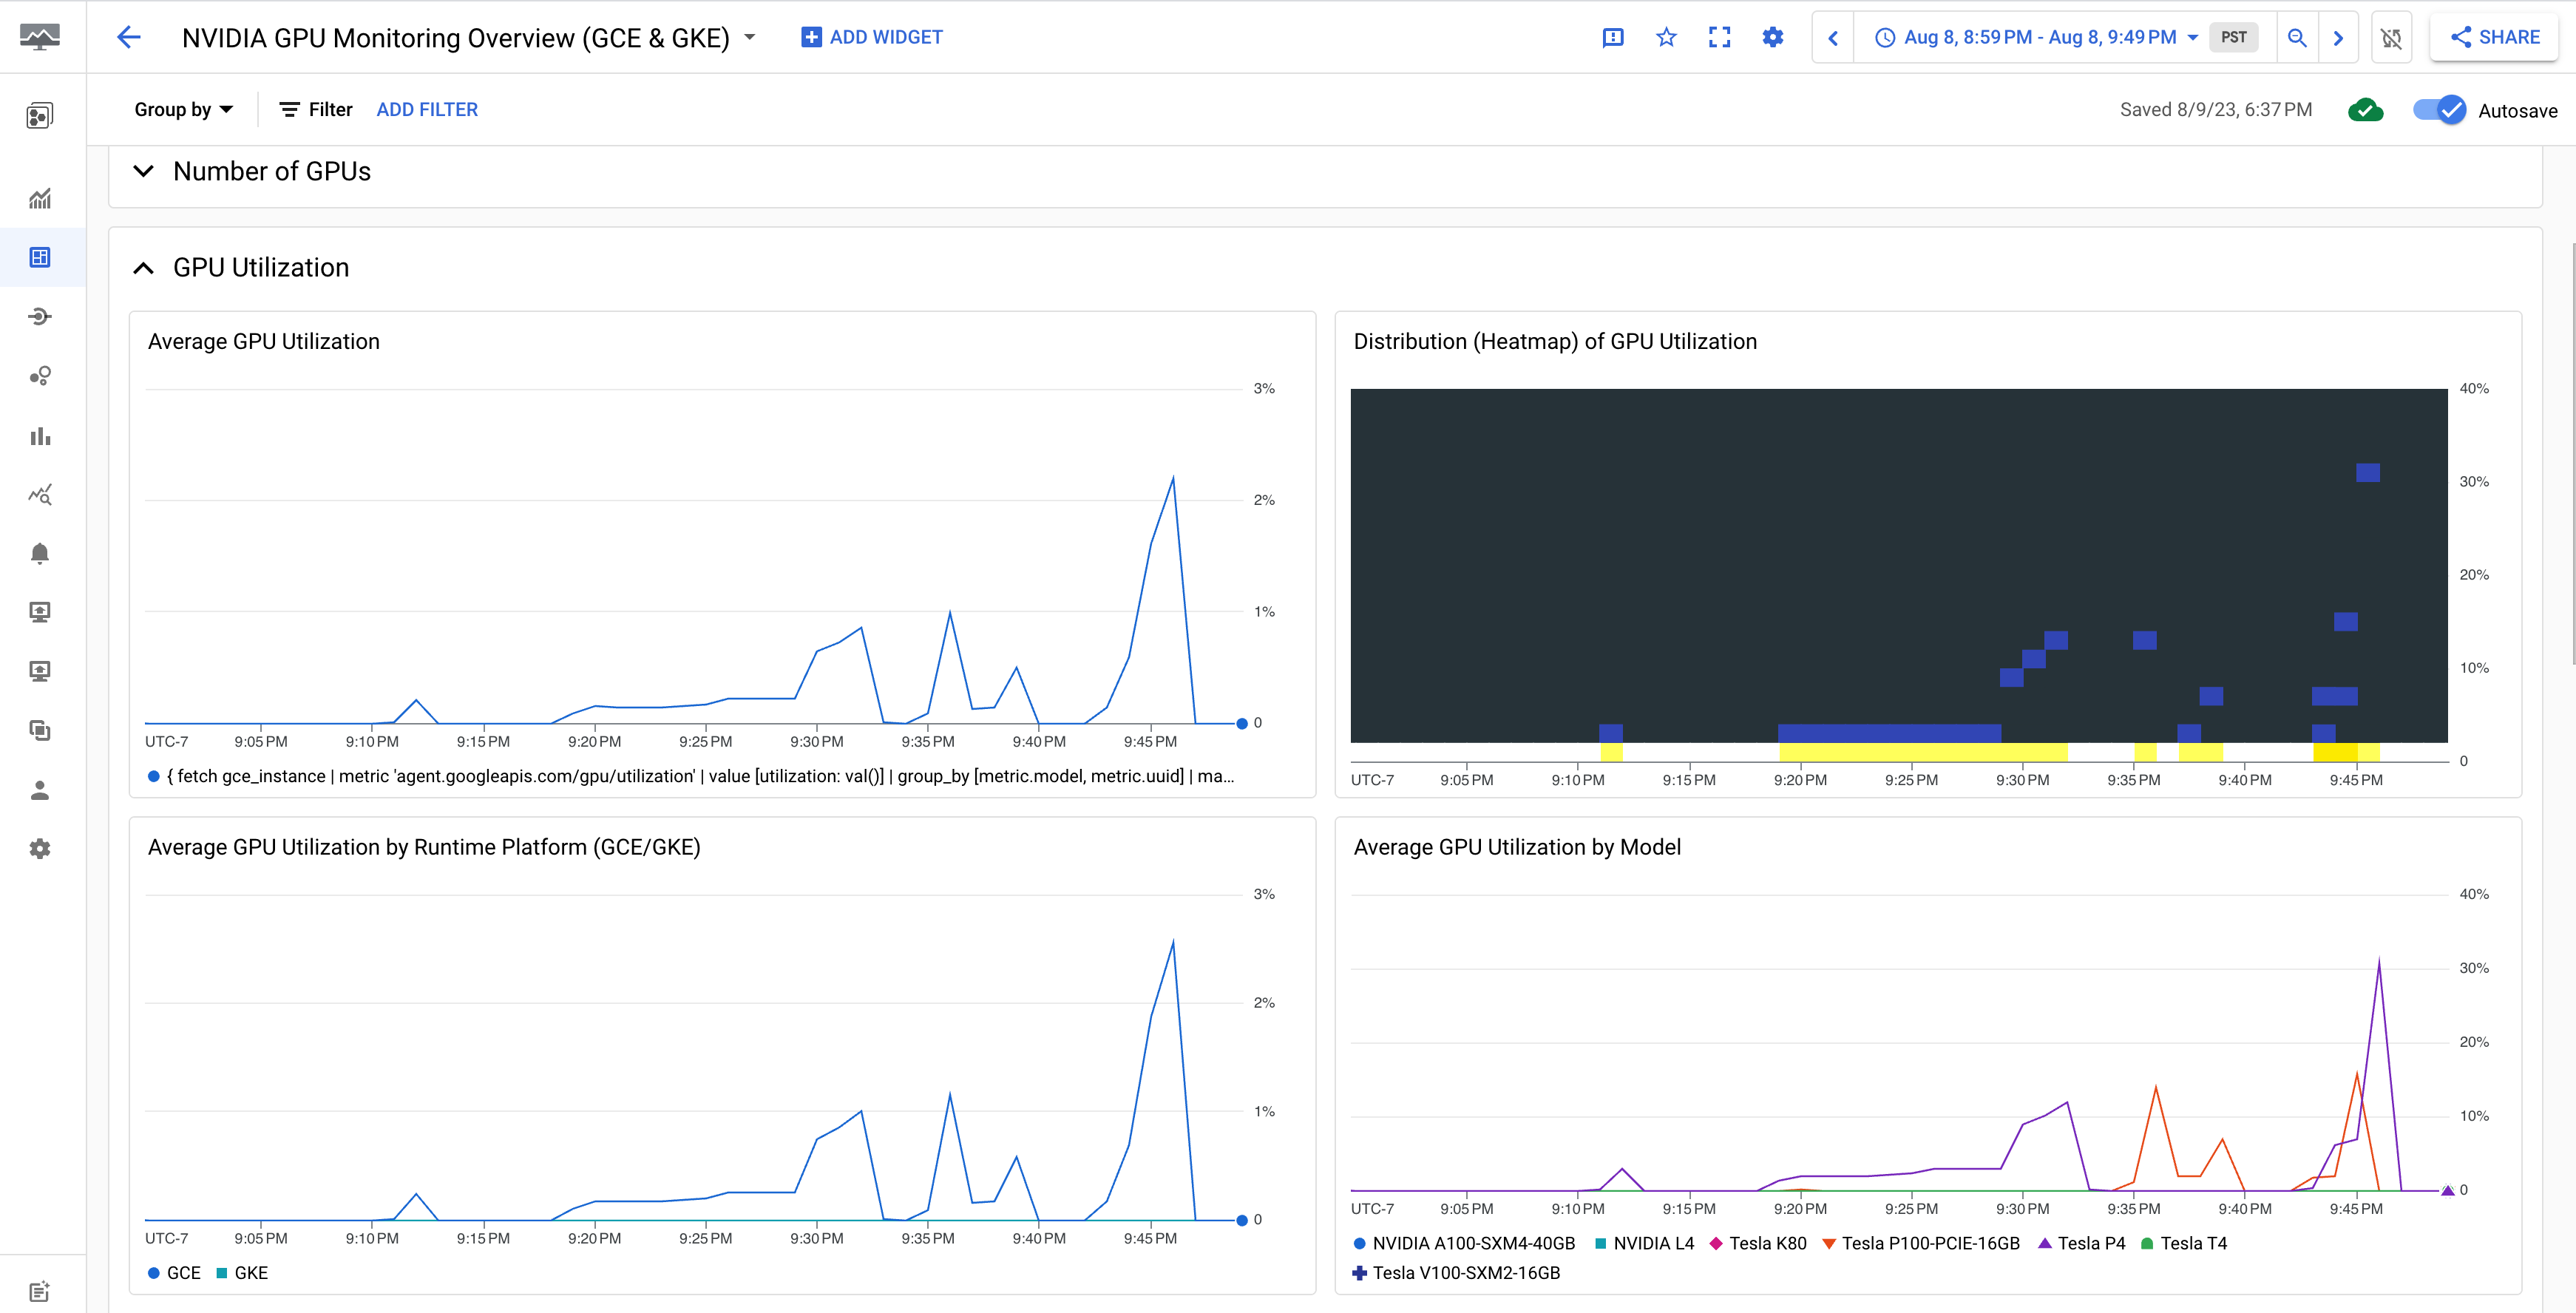
Dasbor NVIDIA GPU Monitoring Overview (GCE dan GKE)
menampilkan metrik GPU seperti penggunaan GPU, rasio traffic NIC,
dan penggunaan memori GPU.
Tampilan pemakaian GPU Anda mirip dengan output berikut:
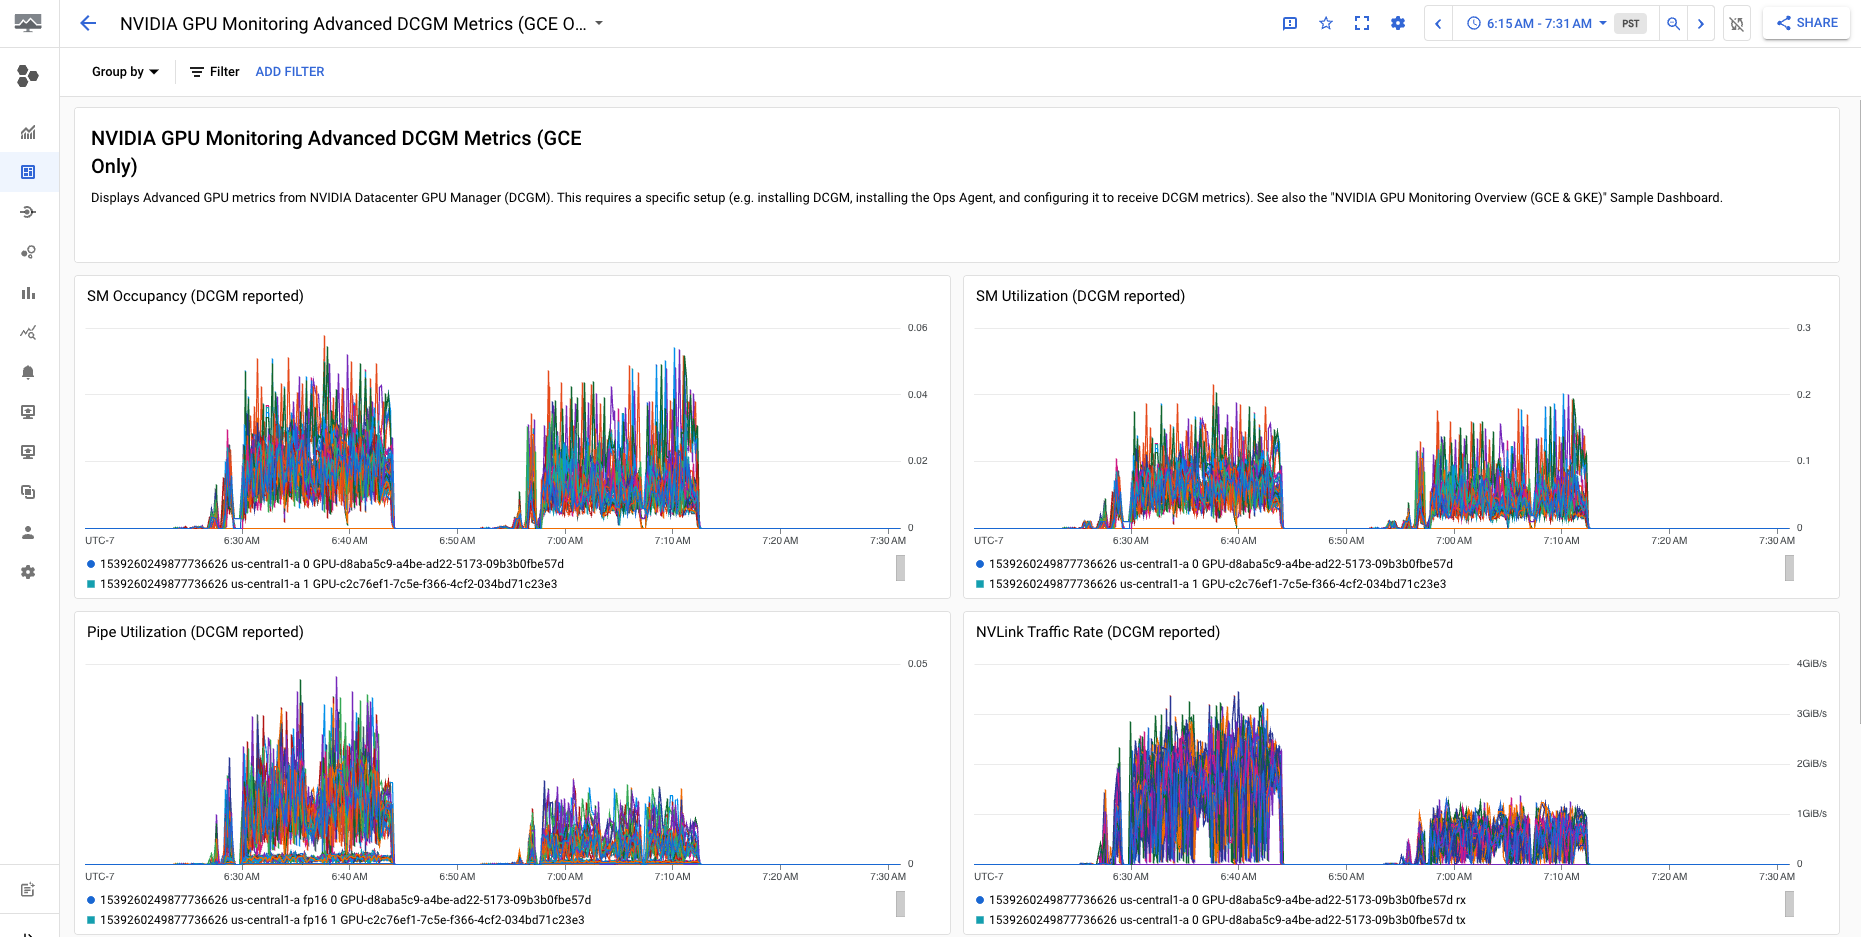
Dasbor
NVIDIA GPU Monitoring Advanced DCGM Metrics (Khusus GCE)
menampilkan metrik lanjutan utama seperti penggunaan SM, jumlah pengguna SM,
penggunaan pipa SM, rasio traffic PCIe, dan rasio traffic NVLink.
Tampilan Metrik DCGM Lanjutan Anda mirip dengan output berikut:
[[["Mudah dipahami","easyToUnderstand","thumb-up"],["Memecahkan masalah saya","solvedMyProblem","thumb-up"],["Lainnya","otherUp","thumb-up"]],[["Sulit dipahami","hardToUnderstand","thumb-down"],["Informasi atau kode contoh salah","incorrectInformationOrSampleCode","thumb-down"],["Informasi/contoh yang saya butuhkan tidak ada","missingTheInformationSamplesINeed","thumb-down"],["Masalah terjemahan","translationIssue","thumb-down"],["Lainnya","otherDown","thumb-down"]],["Terakhir diperbarui pada 2025-08-18 UTC."],[[["\u003cp\u003eThe Ops Agent, version 2.38.0 or later, is Google's recommended solution for tracking GPU utilization and memory on Linux virtual machines (VMs) and can manage your GPU VMs.\u003c/p\u003e\n"],["\u003cp\u003eUsing the Ops Agent, you can visualize GPU fleet health, optimize costs, plan scaling, identify bottlenecks with NVIDIA Data Center GPU Manager (DCGM) profiling metrics, and set alerts.\u003c/p\u003e\n"],["\u003cp\u003eThe Ops Agent collects metrics from the NVIDIA Management Library (NVML) and, with optional DCGM integration, can track advanced GPU metrics such as Streaming Multiprocessor utilization and PCIe traffic rate.\u003c/p\u003e\n"],["\u003cp\u003eTo use the Ops Agent, users must ensure their VMs have attached GPUs, installed GPU drivers, and support the Ops Agent with their Linux operating system, in addition to installing the agent.\u003c/p\u003e\n"],["\u003cp\u003eYou can review NVML metrics within the Compute Engine's Observability tab and review DCGM metrics in the Monitoring section, with provided dashboards.\u003c/p\u003e\n"]]],[],null,["# Monitoring GPU performance on Linux VMs\n\nLinux\n\n*** ** * ** ***\n\n| **Tip:** If you want to monitor A4 or A3 Ultra machine types that are deployed using the features provided by Cluster Director, see [Monitor VMs and clusters](/ai-hypercomputer/docs/monitor) in the AI Hypercomputer documentation instead.\n\nYou can track metrics such as GPU utilization and GPU memory from your\nvirtual machine (VM) instances by using the\n[Ops Agent](/stackdriver/docs/solutions/agents/ops-agent), which is\nGoogle's recommended telemetry collection solution for Compute Engine.\nBy using the Ops Agent, you can manage your GPU VMs as follows:\n\n- Visualize the health of your NVIDIA GPU fleet with our pre-configured dashboards.\n- Optimize costs by identifying underutilized GPUs and consolidating workloads.\n- Plan scaling by looking at trends to decide when to expand GPU capacity or upgrade existing GPUs.\n- Use NVIDIA Data Center GPU Manager (DCGM) profiling metrics to identify bottlenecks and performance issues within your GPUs.\n- Set up [managed instance groups (MIGs)](/compute/docs/instance-groups#managed_instance_groups) to autoscale resources.\n- Get alerts on metrics from your NVIDIA GPUs.\n\nThis document covers the procedures for monitoring GPUs on Linux VMs by using\nthe Ops Agent. Alternatively, a reporting script is available on GitHub that can\nalso be setup for monitoring GPU usage on Linux VMs, see\n[`compute-gpu-monitoring` monitoring script](https://github.com/GoogleCloudPlatform/compute-gpu-monitoring/tree/main/linux).\nThis script is not actively maintained.\n\nFor monitoring GPUs on Windows VMs, see\n[Monitoring GPU performance (Windows)](/compute/docs/gpus/monitor-gpus-windows).\n\nOverview\n--------\n\nThe Ops Agent, version 2.38.0 or later, can automatically track GPU\nutilization and GPU memory usage rates on your Linux VMs that have the agent\ninstalled. These metrics, obtained from the NVIDIA Management Library (NVML),\nare tracked per GPU and per process for any process that uses GPUs.\nTo view the metrics that are monitored by the Ops Agent,\nsee [Agent metrics: gpu](/monitoring/api/metrics_opsagent#agent-gpu).\n\nYou can also set up the NVIDIA Data Center GPU Manager (DCGM) integration with\nthe Ops Agent. This integration allows the Ops Agent to track metrics\nusing the hardware counters on the GPU. DCGM provides access to the\nGPU device-level metrics. These include Streaming Multiprocessor (SM)\nblock utilization, SM occupancy, SM pipe utilization, PCIe traffic rate,\nand NVLink traffic rate. To view the metrics monitored by the Ops Agent, see\n[Third-party application metrics: NVIDIA Data Center GPU Manager (DCGM)](/monitoring/api/metrics_opsagent#opsagent-dcgm).\n\nTo review GPU metrics by using the Ops Agent, complete the following steps:\n\n1. On each VM, check that you have met [the requirements](#requirements).\n2. On each VM, [install the Ops Agent](#install-ops-agent).\n3. Optional: On each VM, set up the [NVIDIA Data Center GPU Manager (DCGM) integration](#dcgm).\n4. Review [metrics in Cloud Monitoring](#review-metrics-dashboard).\n\nLimitations\n-----------\n\n- The Ops Agent doesn't track GPU utilization on VMs that use Container-Optimized OS.\n\nRequirements\n------------\n\nOn each of your VMs, check that you meet the following requirements:\n\n- Each VM must have [GPUs attached](/compute/docs/gpus/create-vm-with-gpus).\n- Each VM must have a [GPU driver installed](/compute/docs/gpus/install-drivers-gpu#verify-driver-install).\n- The Linux operating system and version for each of your VM must support the Ops Agent. See the list of [Linux operating systems](/stackdriver/docs/solutions/agents/ops-agent#linux_operating_systems) that support the Ops Agent.\n- Ensure you have `sudo` access to each VM.\n\nInstall the Ops Agent\n---------------------\n\nTo install the Ops Agent, complete the following steps:\n\n1. If you were previously using the\n [`compute-gpu-monitoring` monitoring script](https://github.com/GoogleCloudPlatform/compute-gpu-monitoring/tree/main/linux)\n to track GPU utilization, disable the service before installing the Ops Agent.\n To disable the monitoring script, run the following command:\n\n ```\n sudo systemctl --no-reload --now disable google_gpu_monitoring_agent\n ```\n2. Install the latest version of the Ops Agent. For detailed instructions, see\n [Installing the Ops Agent](/stackdriver/docs/solutions/agents/ops-agent/install-index).\n\n3. After you have installed the Ops agent, if you need to install or upgrade your\n GPU drivers by using the\n [installation scripts provided by Compute Engine](/compute/docs/gpus/install-drivers-gpu#installation_scripts),\n review the *limitations* section.\n\nReview NVML metrics in Compute Engine\n-------------------------------------\n\nYou can review the NVML metrics that the Ops Agent collects from the\n**Observability** tabs for Compute Engine Linux VM instances.\n\nTo view the metrics for a single VM do the following:\n\n1. In the Google Cloud console, go to the **VM instances** page.\n\n [Go to VM instances](https://console.cloud.google.com/compute/instances)\n2. Select a VM to open the **Details** page.\n\n3. Click the **Observability** tab to display information about the VM.\n\n4. Select the **GPU** quick filter.\n\nTo view the metrics for multiple VMs, do the following:\n\n1. In the Google Cloud console, go to the **VM instances** page.\n\n [Go to VM instances](https://console.cloud.google.com/compute/instances)\n2. Click the **Observability** tab.\n\n3. Select the **GPU** quick filter.\n\nOptional: Set up NVIDIA Data Center GPU Manager (DCGM) integration\n------------------------------------------------------------------\n\nThe Ops Agent also provides integration for NVIDIA Data Center GPU Manager\n(DCGM) to collect key advanced GPU metrics such as Streaming Multiprocessor (SM)\nblock utilization, SM occupancy, SM pipe utilization, PCIe traffic rate,\nand NVLink traffic rate.\n\nThese advanced GPU metrics are not collected from NVIDIA P100 and P4 models.\n\nFor detailed instructions on how to setup and use this integration on each VM,\nsee [NVIDIA Data Center GPU Manager (DCGM)](/stackdriver/docs/solutions/agents/ops-agent/third-party-nvidia).\n\nReview DCGM metrics in Cloud Monitoring\n---------------------------------------\n\n1. In the Google Cloud console, go to the **Monitoring \\\u003e Dashboards** page.\n\n [Go to Monitoring](https://console.cloud.google.com/monitoring/dashboards)\n2. Select the **Sample Library** tab.\n\n3. In the filter_list **Filter** field,\n type **NVIDIA** . The\n **NVIDIA GPU Monitoring Overview (GCE and GKE)**\n dashboard displays.\n\n If you have set up the NVIDIA Data Center GPU Manager (DCGM) integration, the\n **NVIDIA GPU Monitoring Advanced DCGM Metrics (GCE Only)**\n dashboard also displays.\n\n4. For the required dashboard, click **Preview** . The **Sample dashboard preview**\n page displays.\n\n5. From the **Sample dashboard preview** page, click **Import sample dashboard**.\n\n - The **NVIDIA GPU Monitoring Overview (GCE and GKE)**\n dashboard displays the GPU metrics such as GPU utilization, NIC traffic rate,\n and GPU memory usage.\n\n Your GPU utilization display is similar to the following output:\n\n - The\n **NVIDIA GPU Monitoring Advanced DCGM Metrics (GCE Only)**\n dashboard displays key advanced metrics such as SM utilization, SM occupancy,\n SM pipe utilization, PCIe traffic rate, and NVLink traffic rate.\n\n Your Advanced DCGM Metric display is similar to the following output:\n\nWhat's next?\n------------\n\n- To handle GPU host maintenance, see [Handling GPU host maintenance events](/compute/docs/gpus/gpu-host-maintenance).\n- To improve network performance, see [Use higher network bandwidth](/compute/docs/gpus/optimize-gpus)."]]