Tetap teratur dengan koleksi
Simpan dan kategorikan konten berdasarkan preferensi Anda.
Windows
Untuk membantu pemanfaatan resource yang lebih baik, Anda dapat melacak tingkat penggunaan
GPU instance mesin virtual (VM) Anda.
Setelah mengetahui tingkat penggunaan GPU, Anda dapat melakukan tugas-tugas seperti menyiapkan grup instance terkelola yang dapat digunakan untuk menskalakan resource secara otomatis.
Untuk meninjau metrik GPU menggunakan Cloud Monitoring, selesaikan langkah-langkah berikut:
Di setiap VM, siapkan skrip pelaporan metrik GPU.
Skrip ini menginstal agen pelaporan metrik GPU. Agen ini berjalan pada interval di VM untuk mengumpulkan data GPU, dan mengirimkan data ini ke Cloud Monitoring.
Untuk memastikan bahwa Anda dan akun layanan VM memiliki izin yang diperlukan untuk memantau performa GPU di VM Windows, minta administrator untuk memberi Anda dan akun layanan VM peran IAM berikut di project:
Buka terminal PowerShell sebagai administrator, lalu gunakan perintah Invoke-WebRequest untuk mendownload skrip.
Invoke-WebRequest tersedia di PowerShell 3.0 atau yang lebih baru.
Google Cloud merekomendasikan agar Anda menggunakan ctrl+v untuk menempelkan blok kode yang disalin.
mkdir c:\google-scripts
cd c:\google-scripts
Invoke-Webrequest -uri https://raw.githubusercontent.com/GoogleCloudPlatform/compute-gpu-monitoring/main/windows/gce-gpu-monitoring-cuda.ps1 -outfile gce-gpu-monitoring-cuda.ps1
Jalankan skrip:
cd c:\google-scripts
.\gce-gpu-monitoring-cuda.ps1
Mengonfigurasi agen agar otomatis dimulai saat booting
Untuk memastikan bahwa agen pelaporan metrik GPU disiapkan untuk dijalankan saat
booting sistem, gunakan perintah berikut untuk menambahkan agen ke Windows Task
Scheduler.
$Trigger= New-ScheduledTaskTrigger -AtStartup
$Trigger.ExecutionTimeLimit = "PT0S"
$User= "NT AUTHORITY\SYSTEM"
$Action= New-ScheduledTaskAction -Execute "PowerShell.exe" -Argument "C:\google-scripts\gce-gpu-monitoring-cuda.ps1"
$settingsSet = New-ScheduledTaskSettingsSet
# Set the Execution Time Limit to unlimited on all versions of Windows Server
$settingsSet.ExecutionTimeLimit = 'PT0S'
Register-ScheduledTask -TaskName "MonitoringGPUs" -Trigger $Trigger -User $User -Action $Action -Force -Settings $settingsSet
Meninjau metrik di Cloud Monitoring
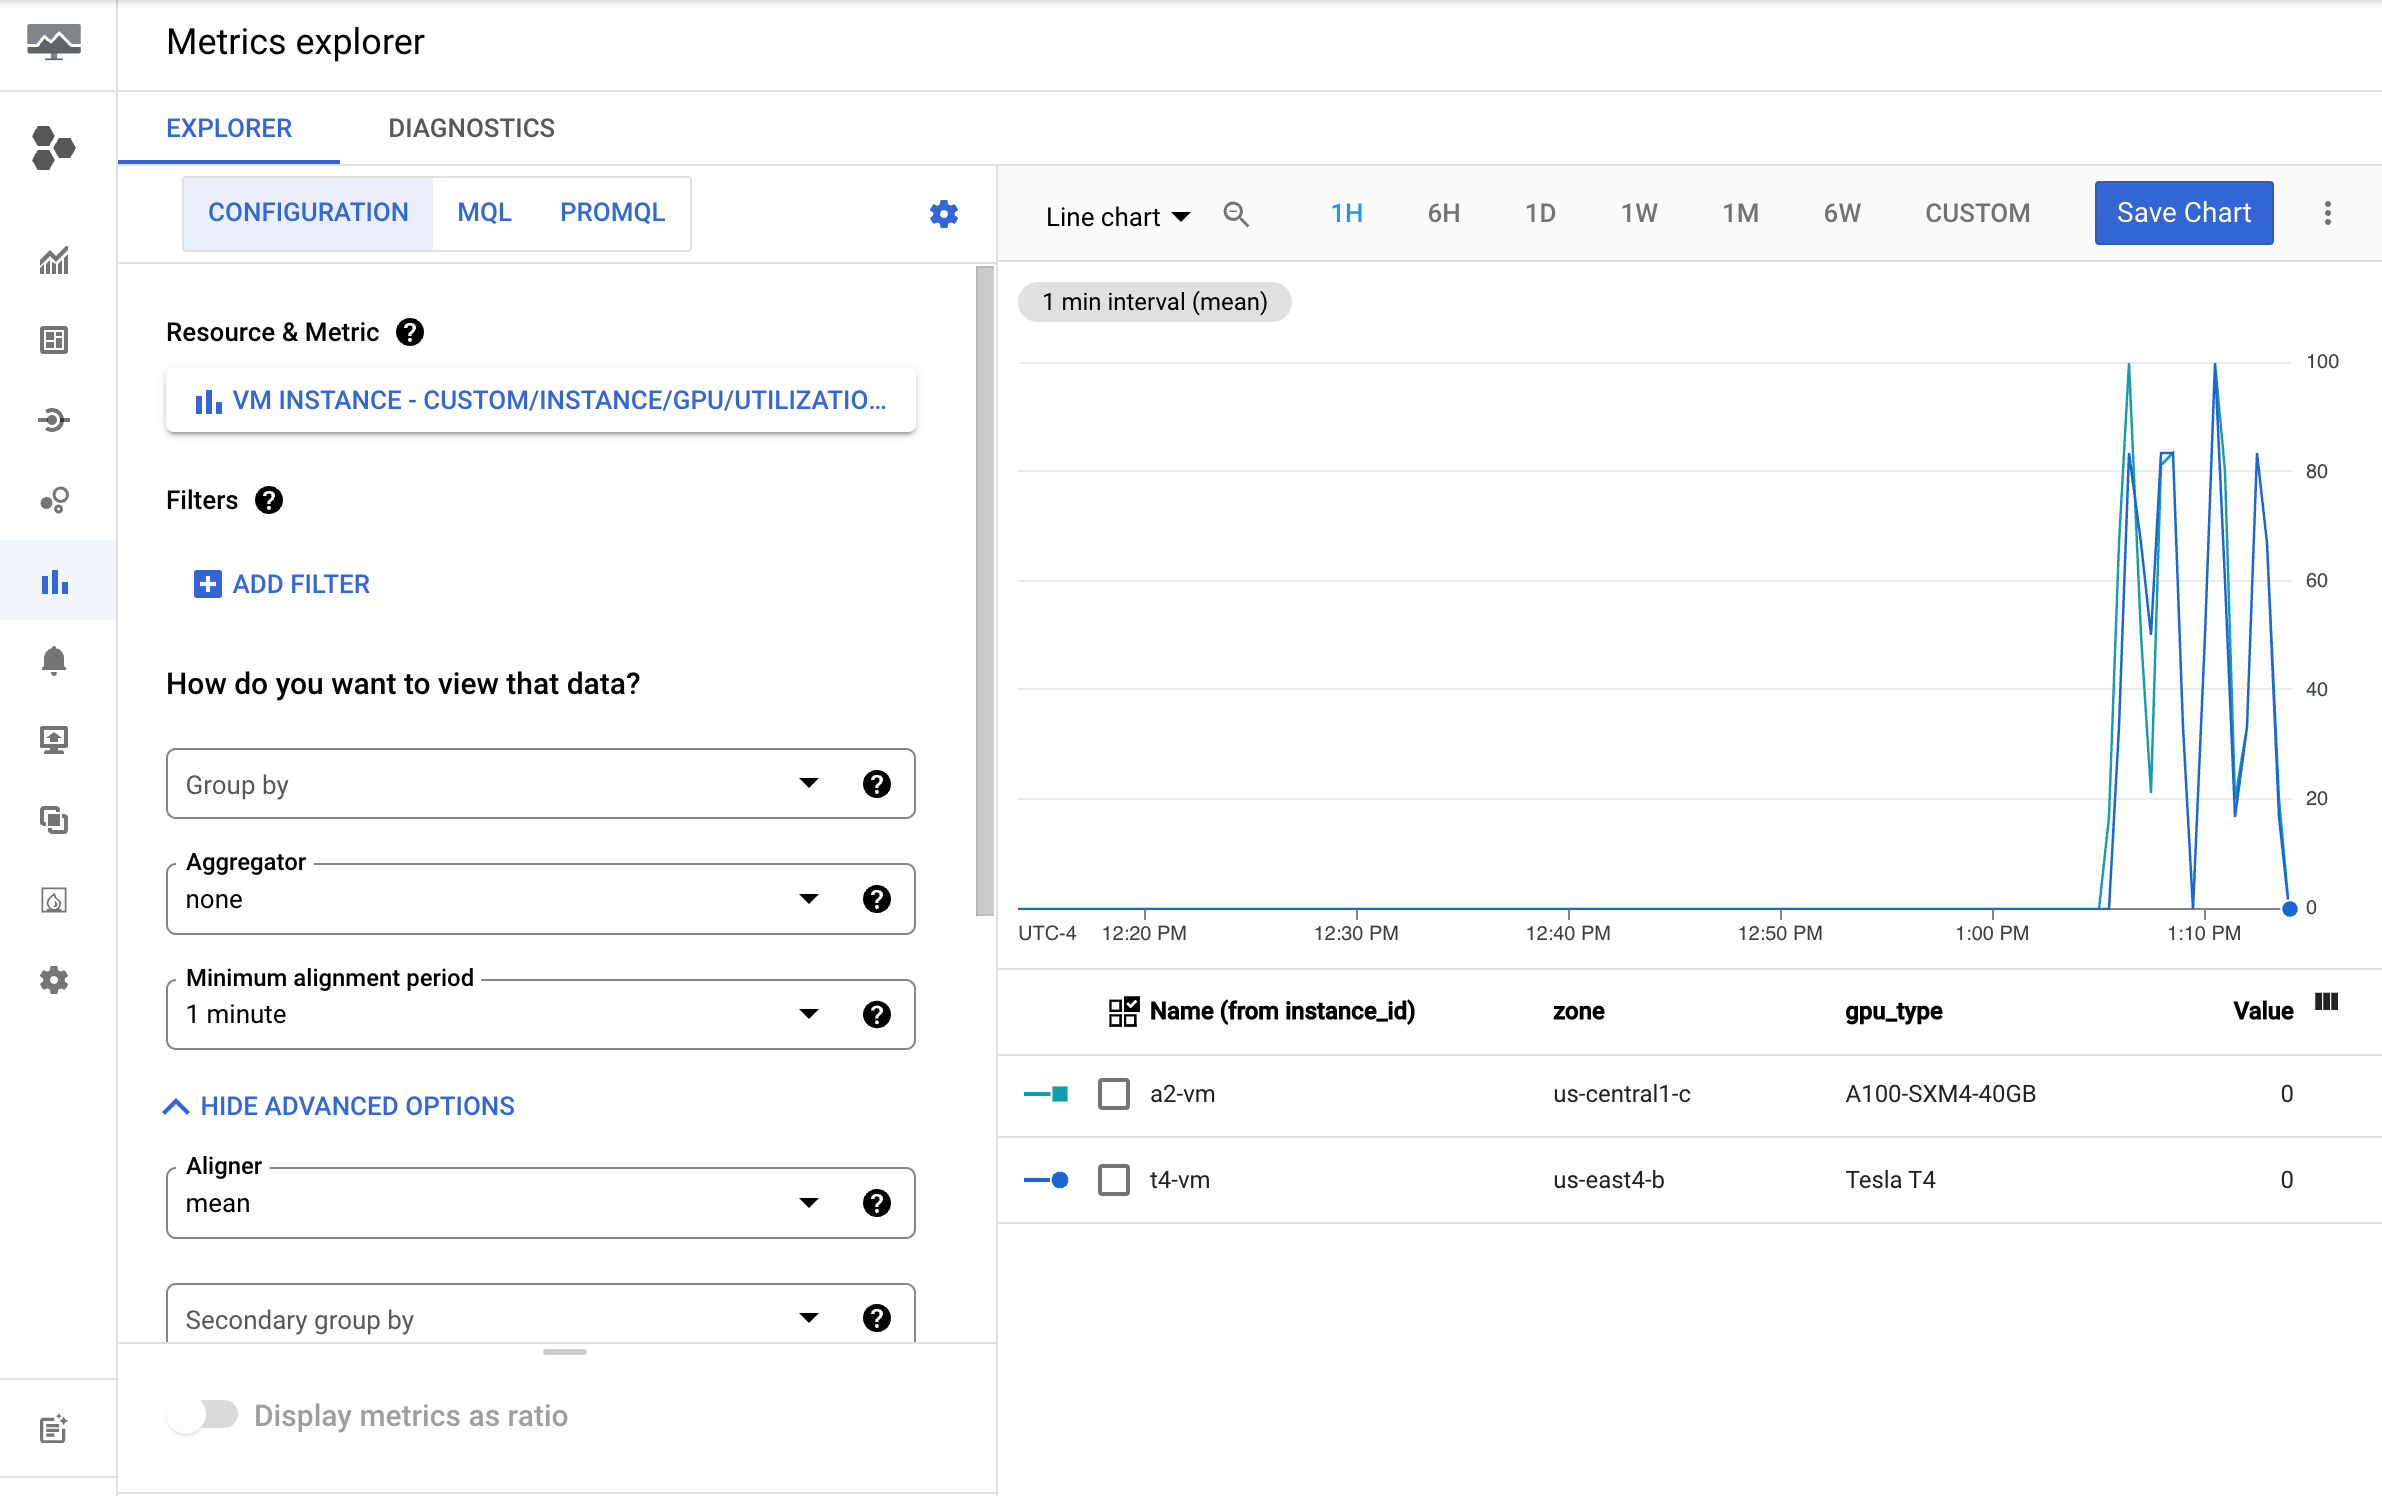
Di Google Cloud konsol, buka halaman Metrics Explorer.
[[["Mudah dipahami","easyToUnderstand","thumb-up"],["Memecahkan masalah saya","solvedMyProblem","thumb-up"],["Lainnya","otherUp","thumb-up"]],[["Sulit dipahami","hardToUnderstand","thumb-down"],["Informasi atau kode contoh salah","incorrectInformationOrSampleCode","thumb-down"],["Informasi/contoh yang saya butuhkan tidak ada","missingTheInformationSamplesINeed","thumb-down"],["Masalah terjemahan","translationIssue","thumb-down"],["Lainnya","otherDown","thumb-down"]],["Terakhir diperbarui pada 2025-08-18 UTC."],[[["\u003cp\u003eThis document guides you through tracking GPU usage rates on Windows virtual machines (VMs) to optimize resource utilization, including setting up managed instance groups for autoscaling.\u003c/p\u003e\n"],["\u003cp\u003eMonitoring GPU performance requires granting specific Identity and Access Management (IAM) roles, such as Compute Instance Admin (v1) and Monitoring Metric Writer, to both the VM's service account and your user account.\u003c/p\u003e\n"],["\u003cp\u003eTo monitor GPU metrics, you must set up and run a GPU metrics reporting script on each VM, ensuring each VM has GPUs attached and a GPU driver installed.\u003c/p\u003e\n"],["\u003cp\u003eThe GPU metrics reporting agent can be configured to automatically start on boot via the Windows Task Scheduler, ensuring continuous data collection.\u003c/p\u003e\n"],["\u003cp\u003eYou can view collected GPU data, such as utilization, memory usage, and temperature, in Google Cloud's Metrics Explorer by selecting the custom metrics under the VM Instance resource.\u003c/p\u003e\n"]]],[],null,["# Monitoring GPU performance on Windows VMs\n\nWindows\n\n*** ** * ** ***\n\nTo help with better utilization of resources, you can track the GPU usage\nrates of your virtual machine (VM) instances.\n\nWhen you know the GPU usage rates,\nyou can perform tasks such as\nsetting up [managed instance groups](/compute/docs/instance-groups#managed_instance_groups)\nthat can be used to autoscale resources.\n\nTo review GPU metrics using [Cloud Monitoring](/monitoring/docs), complete\nthe following steps:\n\n1. On each VM, [set up the GPU metrics reporting script](#setup-script). This script installs the GPU metrics reporting agent. This agent runs at intervals on the VM to collect GPU data, and sends this data to Cloud Monitoring.\n2. On each VM, [run the script](#run-script).\n3. On each VM, set GPU metrics reporting agent to [automatically start on boot](#autostart).\n4. [View logs in Google Cloud Cloud Monitoring](#review-metrics).\n\nRequired roles\n--------------\n\nTo monitor GPU performance on Windows VMs, you need to grant the required\nIdentity and Access Management (IAM) roles to the following principles:\n\n- The [service account](/compute/docs/instances/change-service-account#serviceaccountname) that is used by the VM instance\n- Your user account\n\n\nTo ensure that you and the VM's service account has the necessary\npermissions to monitor GPU performance on Windows VMs,\n\nask your administrator to grant you and the VM's service account the\nfollowing IAM roles on the project:\n\n- [Compute Instance Admin (v1)](/iam/docs/roles-permissions/compute#compute.instanceAdmin.v1) (`roles/compute.instanceAdmin.v1`)\n- [Monitoring Metric Writer](/iam/docs/roles-permissions/monitoring#monitoring.metricWriter) (`roles/monitoring.metricWriter`)\n\n\nFor more information about granting roles, see [Manage access to projects, folders, and organizations](/iam/docs/granting-changing-revoking-access).\n\n\nYour administrator might also be able to give you and the VM's service account\nthe required permissions through [custom\nroles](/iam/docs/creating-custom-roles) or other [predefined\nroles](/iam/docs/roles-overview#predefined).\n\nSet up the GPU metrics reporting script\n---------------------------------------\n\n### Requirements\n\nOn each of your VMs, check that you meet the following requirements:\n\n- Each VM must have [GPUs attached](/compute/docs/gpus/create-vm-with-gpus).\n- Each VM must have a [GPU driver installed](/compute/docs/gpus/install-drivers-gpu#verify-driver-install).\n\n### Download the script\n\nOpen a PowerShell terminal as an administrator and use the\n[`Invoke-WebRequest` command](https://docs.microsoft.com/en-us/powershell/module/microsoft.powershell.utility/invoke-webrequest?view=powershell-7.1) to download the script.\n\n`Invoke-WebRequest` is available on PowerShell 3.0 or later.\nGoogle Cloud recommends that you use `ctrl+v` to paste the copied code blocks. \n\n```bash\nmkdir c:\\google-scripts\ncd c:\\google-scripts\nInvoke-Webrequest -uri https://raw.githubusercontent.com/GoogleCloudPlatform/compute-gpu-monitoring/main/windows/gce-gpu-monitoring-cuda.ps1 -outfile gce-gpu-monitoring-cuda.ps1\n```\n\nRun the script\n--------------\n\n```bash\ncd c:\\google-scripts\n.\\gce-gpu-monitoring-cuda.ps1\n```\n\nConfigure the agent to automatically start on boot\n--------------------------------------------------\n\nTo ensure that the GPU metrics reporting agent agent is set up to run on\nsystem boot, use the following command to add the agent to the Windows Task\nScheduler. \n\n```bash\n$Trigger= New-ScheduledTaskTrigger -AtStartup\n$Trigger.ExecutionTimeLimit = \"PT0S\"\n$User= \"NT AUTHORITY\\SYSTEM\"\n$Action= New-ScheduledTaskAction -Execute \"PowerShell.exe\" -Argument \"C:\\google-scripts\\gce-gpu-monitoring-cuda.ps1\"\n$settingsSet = New-ScheduledTaskSettingsSet\n# Set the Execution Time Limit to unlimited on all versions of Windows Server\n$settingsSet.ExecutionTimeLimit = 'PT0S'\nRegister-ScheduledTask -TaskName \"MonitoringGPUs\" -Trigger $Trigger -User $User -Action $Action -Force -Settings $settingsSet\n```\n\nReview metrics in Cloud Monitoring\n----------------------------------\n\n1. In the Google Cloud console, go to the **Metrics Explorer** page.\n\n [Go to Monitoring](https://console.cloud.google.com/monitoring/metrics-explorer)\n2. Expand the **Select a metric** menu.\n\n3. In the **Resource** menu, select **VM Instance**.\n\n4. In the **Metric category** menu, select **Custom**.\n\n5. In the **Metric** menu, select the metric to chart. For example\n `custom/instance/gpu/utilization`.\n\n | **Note:** Custom metrics might take some time to display.\n6. Click **Apply**.\n\n Your GPU utilization should resemble the following output:\n\nAvailable metrics\n-----------------\n\nWhat's next?\n------------\n\n- To handle GPU host maintenance, see [Handling GPU host maintenance events](/compute/docs/gpus/gpu-host-maintenance).\n- To improve network performance, see [Use higher network bandwidth](/compute/docs/gpus/optimize-gpus)."]]