Wenn Sie die GPU-Leistung auf Windows-VMs überwachen möchten, müssen Sie den folgenden Hauptkonten die erforderlichen IAM-Rollen (Identity and Access Management) zuweisen:
Das Dienstkonto, das von der VM-Instanz verwendet wird
Ihr Nutzerkonto
Damit Sie und das Dienstkonto der VM die erforderlichen Berechtigungen zum Überwachen der GPU-Leistung auf Windows-VMs haben, bitten Sie Ihren Administrator, Ihnen und dem Dienstkonto der VM die folgenden IAM-Rollen für das Projekt zuzuweisen:
Ihr Administrator kann Ihnen und dem Dienstkonto der VM möglicherweise auch die erforderlichen Berechtigungen über benutzerdefinierte Rollen oder andere vordefinierte Rollen erteilen.
Berichtsskript für GPU-Messwerte einrichten
Voraussetzungen
Prüfen Sie auf allen VMs, ob die folgenden Anforderungen erfüllt werden:
Öffnen Sie ein PowerShell-Terminal als Administrator und laden Sie das Skript mit dem Befehl Invoke-WebRequest herunter.
Invoke-WebRequest ist ab PowerShell 3.0 verfügbar.
Google Cloud empfiehlt, die kopierten Codeblöcke mit ctrl+v einzufügen.
mkdir c:\google-scripts
cd c:\google-scripts
Invoke-Webrequest -uri https://raw.githubusercontent.com/GoogleCloudPlatform/compute-gpu-monitoring/main/windows/gce-gpu-monitoring-cuda.ps1 -outfile gce-gpu-monitoring-cuda.ps1
Skript ausführen
cd c:\google-scripts
.\gce-gpu-monitoring-cuda.ps1
Agent so konfigurieren, dass er beim Booten automatisch gestartet wird
Wenn Sie prüfen möchten, ob der Agent für Berichte mit GPU-Messwerten beim Systemstart ausgeführt wird, fügen Sie ihn mit dem folgenden Befehl dem Windows-Aufgabenplaner hinzu.
$Trigger= New-ScheduledTaskTrigger -AtStartup
$Trigger.ExecutionTimeLimit = "PT0S"
$User= "NT AUTHORITY\SYSTEM"
$Action= New-ScheduledTaskAction -Execute "PowerShell.exe" -Argument "C:\google-scripts\gce-gpu-monitoring-cuda.ps1"
$settingsSet = New-ScheduledTaskSettingsSet
# Set the Execution Time Limit to unlimited on all versions of Windows Server
$settingsSet.ExecutionTimeLimit = 'PT0S'
Register-ScheduledTask -TaskName "MonitoringGPUs" -Trigger $Trigger -User $User -Action $Action -Force -Settings $settingsSet
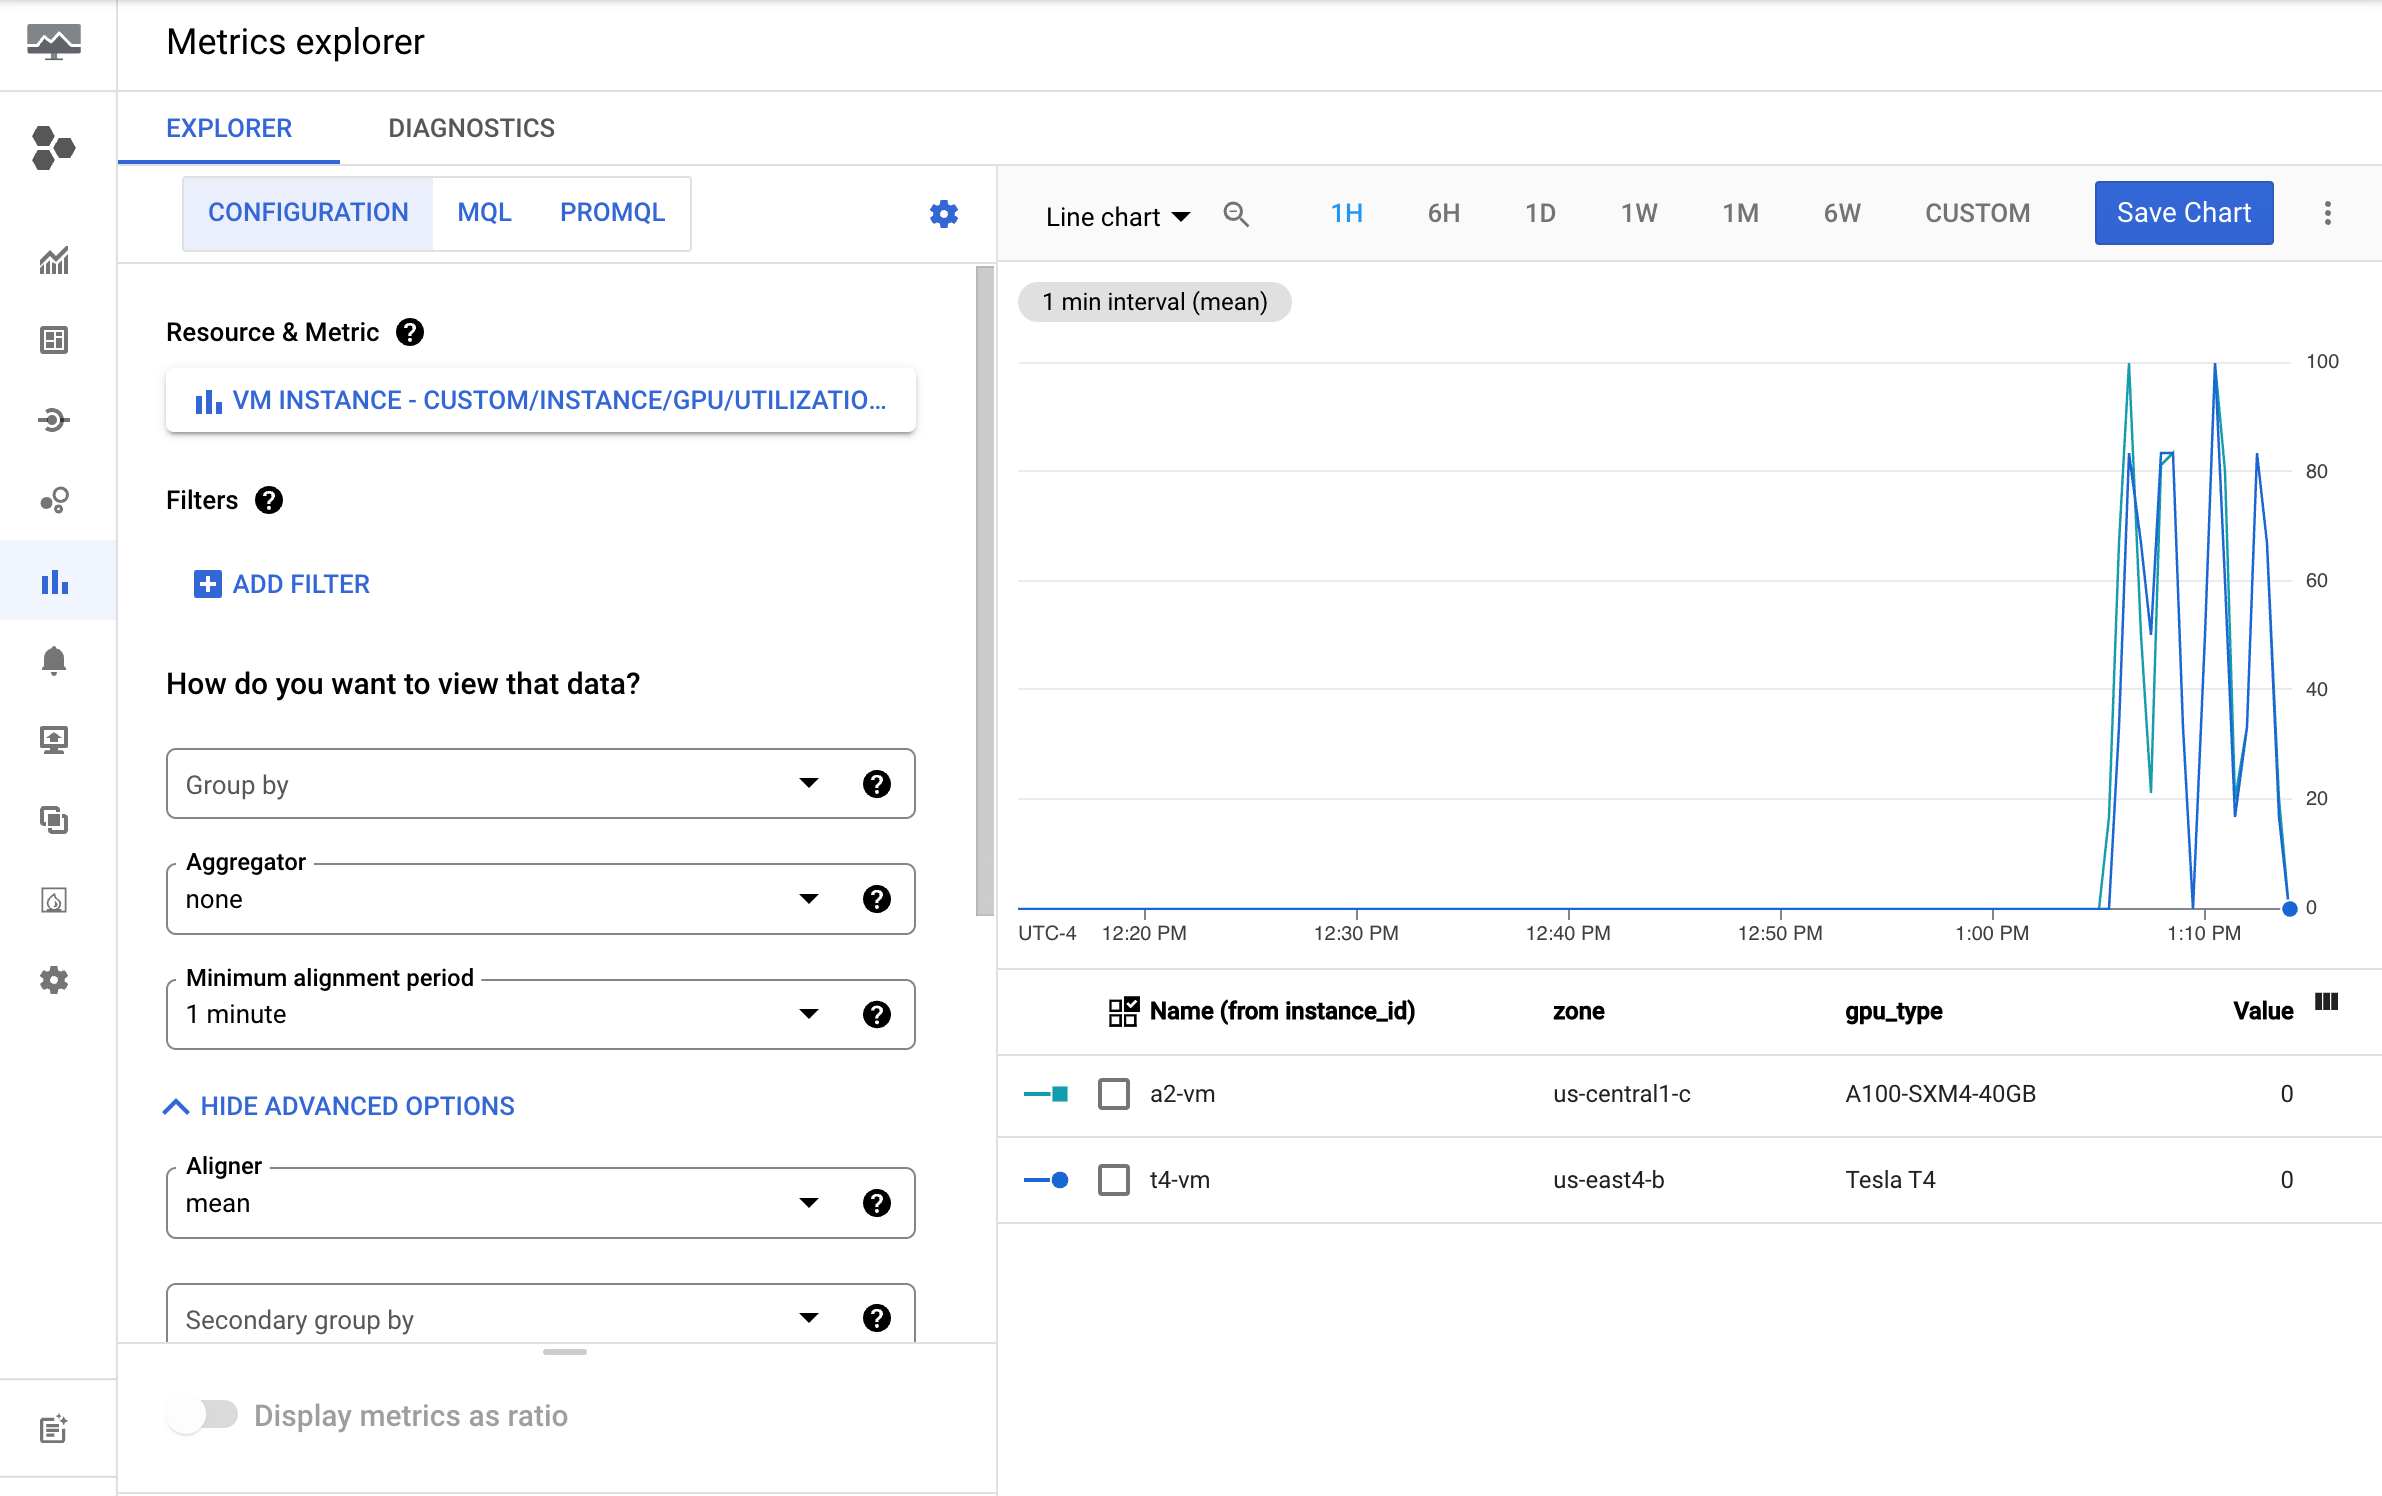
Messwerte in Cloud Monitoring prüfen
Rufen Sie in der Google Cloud Console die Seite Metrics Explorer auf.
Wählen Sie im Menü Ressource die Option VM-Instanz aus.
Wählen Sie im Menü Messwertkategorie die Option Benutzerdefiniert aus.
Wählen Sie im Menü Messwert den Messwert aus, der dargestellt werden soll. Beispiel: custom/instance/gpu/utilization.
Klicken Sie auf Anwenden.
Ihre GPU-Auslastung sollte der folgenden Ausgabe entsprechen:
Verfügbare Messwerte
Messwertname
Beschreibung
instance/gpu/utilization
Prozentsatz der Zeit während des vergangenen Stichprobenzeitraums, in der mindestens ein Kernel auf der GPU ausgeführt wurde.
instance/gpu/memory_utilization
Prozentsatz der Zeit während des vergangenen Stichprobenzeitraums, in der in den globalen Arbeitsspeicher (von Geräten) geschrieben oder aus diesem gelesen wurde.
instance/gpu/memory_total
Gesamter installierter GPU-Arbeitsspeicher.
instance/gpu/memory_used
Gesamter von aktiven Kontexten zugewiesener Arbeitsspeicher.
instance/gpu/memory_used_percent
Prozentsatz des Gesamtspeichers, der von aktiven Kontexten zugewiesen wird. Liegt im Bereich von 1 % bis 100 %.
[[["Leicht verständlich","easyToUnderstand","thumb-up"],["Mein Problem wurde gelöst","solvedMyProblem","thumb-up"],["Sonstiges","otherUp","thumb-up"]],[["Schwer verständlich","hardToUnderstand","thumb-down"],["Informationen oder Beispielcode falsch","incorrectInformationOrSampleCode","thumb-down"],["Benötigte Informationen/Beispiele nicht gefunden","missingTheInformationSamplesINeed","thumb-down"],["Problem mit der Übersetzung","translationIssue","thumb-down"],["Sonstiges","otherDown","thumb-down"]],["Zuletzt aktualisiert: 2025-08-18 (UTC)."],[[["\u003cp\u003eThis document guides you through tracking GPU usage rates on Windows virtual machines (VMs) to optimize resource utilization, including setting up managed instance groups for autoscaling.\u003c/p\u003e\n"],["\u003cp\u003eMonitoring GPU performance requires granting specific Identity and Access Management (IAM) roles, such as Compute Instance Admin (v1) and Monitoring Metric Writer, to both the VM's service account and your user account.\u003c/p\u003e\n"],["\u003cp\u003eTo monitor GPU metrics, you must set up and run a GPU metrics reporting script on each VM, ensuring each VM has GPUs attached and a GPU driver installed.\u003c/p\u003e\n"],["\u003cp\u003eThe GPU metrics reporting agent can be configured to automatically start on boot via the Windows Task Scheduler, ensuring continuous data collection.\u003c/p\u003e\n"],["\u003cp\u003eYou can view collected GPU data, such as utilization, memory usage, and temperature, in Google Cloud's Metrics Explorer by selecting the custom metrics under the VM Instance resource.\u003c/p\u003e\n"]]],[],null,["# Monitoring GPU performance on Windows VMs\n\nWindows\n\n*** ** * ** ***\n\nTo help with better utilization of resources, you can track the GPU usage\nrates of your virtual machine (VM) instances.\n\nWhen you know the GPU usage rates,\nyou can perform tasks such as\nsetting up [managed instance groups](/compute/docs/instance-groups#managed_instance_groups)\nthat can be used to autoscale resources.\n\nTo review GPU metrics using [Cloud Monitoring](/monitoring/docs), complete\nthe following steps:\n\n1. On each VM, [set up the GPU metrics reporting script](#setup-script). This script installs the GPU metrics reporting agent. This agent runs at intervals on the VM to collect GPU data, and sends this data to Cloud Monitoring.\n2. On each VM, [run the script](#run-script).\n3. On each VM, set GPU metrics reporting agent to [automatically start on boot](#autostart).\n4. [View logs in Google Cloud Cloud Monitoring](#review-metrics).\n\nRequired roles\n--------------\n\nTo monitor GPU performance on Windows VMs, you need to grant the required\nIdentity and Access Management (IAM) roles to the following principles:\n\n- The [service account](/compute/docs/instances/change-service-account#serviceaccountname) that is used by the VM instance\n- Your user account\n\n\nTo ensure that you and the VM's service account has the necessary\npermissions to monitor GPU performance on Windows VMs,\n\nask your administrator to grant you and the VM's service account the\nfollowing IAM roles on the project:\n\n- [Compute Instance Admin (v1)](/iam/docs/roles-permissions/compute#compute.instanceAdmin.v1) (`roles/compute.instanceAdmin.v1`)\n- [Monitoring Metric Writer](/iam/docs/roles-permissions/monitoring#monitoring.metricWriter) (`roles/monitoring.metricWriter`)\n\n\nFor more information about granting roles, see [Manage access to projects, folders, and organizations](/iam/docs/granting-changing-revoking-access).\n\n\nYour administrator might also be able to give you and the VM's service account\nthe required permissions through [custom\nroles](/iam/docs/creating-custom-roles) or other [predefined\nroles](/iam/docs/roles-overview#predefined).\n\nSet up the GPU metrics reporting script\n---------------------------------------\n\n### Requirements\n\nOn each of your VMs, check that you meet the following requirements:\n\n- Each VM must have [GPUs attached](/compute/docs/gpus/create-vm-with-gpus).\n- Each VM must have a [GPU driver installed](/compute/docs/gpus/install-drivers-gpu#verify-driver-install).\n\n### Download the script\n\nOpen a PowerShell terminal as an administrator and use the\n[`Invoke-WebRequest` command](https://docs.microsoft.com/en-us/powershell/module/microsoft.powershell.utility/invoke-webrequest?view=powershell-7.1) to download the script.\n\n`Invoke-WebRequest` is available on PowerShell 3.0 or later.\nGoogle Cloud recommends that you use `ctrl+v` to paste the copied code blocks. \n\n```bash\nmkdir c:\\google-scripts\ncd c:\\google-scripts\nInvoke-Webrequest -uri https://raw.githubusercontent.com/GoogleCloudPlatform/compute-gpu-monitoring/main/windows/gce-gpu-monitoring-cuda.ps1 -outfile gce-gpu-monitoring-cuda.ps1\n```\n\nRun the script\n--------------\n\n```bash\ncd c:\\google-scripts\n.\\gce-gpu-monitoring-cuda.ps1\n```\n\nConfigure the agent to automatically start on boot\n--------------------------------------------------\n\nTo ensure that the GPU metrics reporting agent agent is set up to run on\nsystem boot, use the following command to add the agent to the Windows Task\nScheduler. \n\n```bash\n$Trigger= New-ScheduledTaskTrigger -AtStartup\n$Trigger.ExecutionTimeLimit = \"PT0S\"\n$User= \"NT AUTHORITY\\SYSTEM\"\n$Action= New-ScheduledTaskAction -Execute \"PowerShell.exe\" -Argument \"C:\\google-scripts\\gce-gpu-monitoring-cuda.ps1\"\n$settingsSet = New-ScheduledTaskSettingsSet\n# Set the Execution Time Limit to unlimited on all versions of Windows Server\n$settingsSet.ExecutionTimeLimit = 'PT0S'\nRegister-ScheduledTask -TaskName \"MonitoringGPUs\" -Trigger $Trigger -User $User -Action $Action -Force -Settings $settingsSet\n```\n\nReview metrics in Cloud Monitoring\n----------------------------------\n\n1. In the Google Cloud console, go to the **Metrics Explorer** page.\n\n [Go to Monitoring](https://console.cloud.google.com/monitoring/metrics-explorer)\n2. Expand the **Select a metric** menu.\n\n3. In the **Resource** menu, select **VM Instance**.\n\n4. In the **Metric category** menu, select **Custom**.\n\n5. In the **Metric** menu, select the metric to chart. For example\n `custom/instance/gpu/utilization`.\n\n | **Note:** Custom metrics might take some time to display.\n6. Click **Apply**.\n\n Your GPU utilization should resemble the following output:\n\nAvailable metrics\n-----------------\n\nWhat's next?\n------------\n\n- To handle GPU host maintenance, see [Handling GPU host maintenance events](/compute/docs/gpus/gpu-host-maintenance).\n- To improve network performance, see [Use higher network bandwidth](/compute/docs/gpus/optimize-gpus)."]]