A partir de 29 de abril de 2025, os modelos Gemini 1.5 Pro e Gemini 1.5 Flash não estarão disponíveis em projetos que não os usaram antes, incluindo novos projetos. Para mais detalhes, consulte Versões e ciclo de vida do modelo.
Mantenha tudo organizado com as coleções
Salve e categorize o conteúdo com base nas suas preferências.
Nesta página, mostramos como ativar o Cloud Trace no seu agente
e visualizar rastreamentos para analisar tempos de resposta de consultas e operações executadas.
Um rastreamento
é uma linha do tempo de solicitações à medida que o agente responde a cada consulta. Por exemplo, o gráfico de Gantt a seguir mostra um trace de amostra de um LangchainAgent:
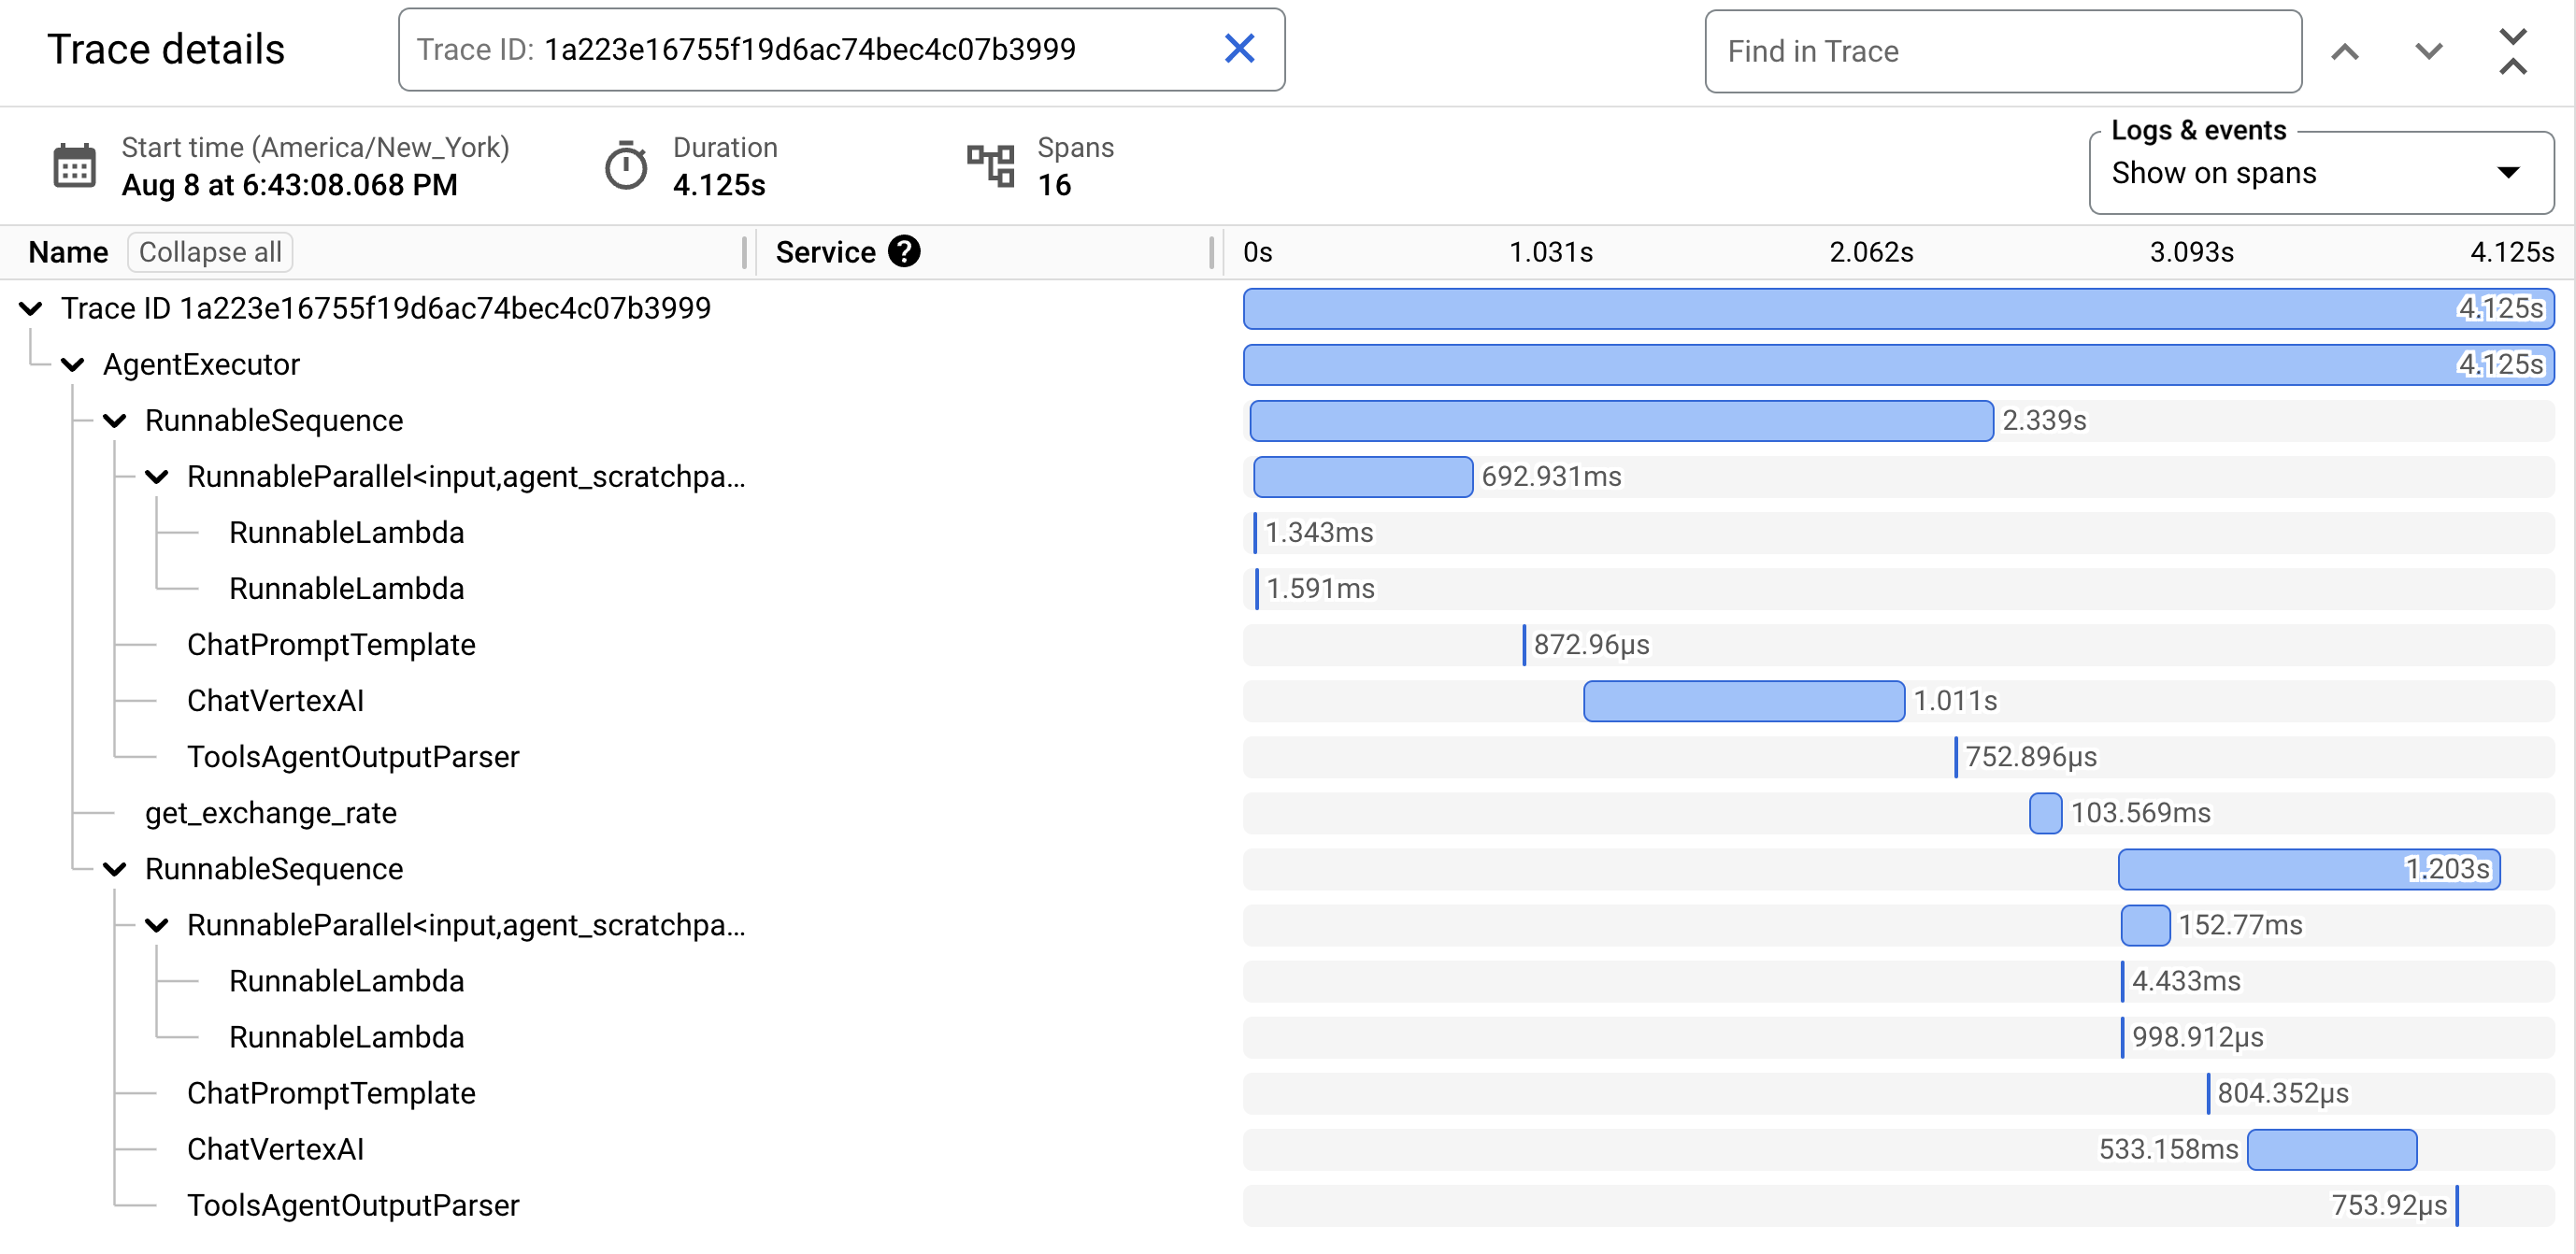
A primeira linha no diagrama de Gantt é para o trace. Um rastreamento é composto de períodos individuais, que representam uma única unidade de trabalho, como uma chamada de função ou uma interação com um LLM. O primeiro período representa a solicitação geral. Cada período fornece detalhes sobre uma operação específica, como nome, horários de início e término e atributos relevantes dentro da solicitação. Por exemplo, o JSON a seguir mostra um único intervalo que representa
uma chamada para um modelo de linguagem grande (LLM):
{"name":"llm","context":{"trace_id":"ed7b336d-e71a-46f0-a334-5f2e87cb6cfc","span_id":"ad67332a-38bd-428e-9f62-538ba2fa90d4"},"span_kind":"LLM","parent_id":"f89ebb7c-10f6-4bf8-8a74-57324d2556ef","start_time":"2023-09-07T12:54:47.597121-06:00","end_time":"2023-09-07T12:54:49.321811-06:00","status_code":"OK","status_message":"","attributes":{"llm.input_messages":[{"message.role":"system","message.content":"You are an expert Q&A system that is trusted around the world.\nAlways answer the query using the provided context information, and not prior knowledge.\nSome rules to follow:\n1. Never directly reference the given context in your answer.\n2. Avoid statements like 'Based on the context, ...' or 'The context information ...' or anything along those lines."},{"message.role":"user","message.content":"Hello?"}],"output.value":"assistant: Yes I am here","output.mime_type":"text/plain"},"events":[],}
Para receber as permissões necessárias para ver os dados de rastreamento no console Google Cloud ou selecionar um escopo de rastreamento, peça ao administrador para conceder a você o papel do IAM Usuário do Cloud Trace (roles/cloudtrace.user) no seu projeto.
Acesse o Explorador de traces no console Google Cloud :
[[["Fácil de entender","easyToUnderstand","thumb-up"],["Meu problema foi resolvido","solvedMyProblem","thumb-up"],["Outro","otherUp","thumb-up"]],[["Difícil de entender","hardToUnderstand","thumb-down"],["Informações incorretas ou exemplo de código","incorrectInformationOrSampleCode","thumb-down"],["Não contém as informações/amostras de que eu preciso","missingTheInformationSamplesINeed","thumb-down"],["Problema na tradução","translationIssue","thumb-down"],["Outro","otherDown","thumb-down"]],["Última atualização 2025-08-25 UTC."],[],[],null,["# Trace an agent\n\nThis page shows you how to enable [Cloud Trace](/trace/docs/overview) on your agent\nand view traces to analyze query response times and executed operations.\n\nA [**trace**](https://opentelemetry.io/docs/concepts/signals/traces/)\nis a timeline of requests as your agent responds to each query. For example, the following Gantt chart shows a sample trace from a `LangchainAgent`:\n\n\u003cbr /\u003e\n\nThe first row in the Gantt chart is for the trace. A trace is\ncomposed of individual [**spans**](https://opentelemetry.io/docs/concepts/signals/traces/#spans), which\nrepresent a single unit of work, like a function call or an interaction with an\nLLM, with the first span representing the overall\nrequest. Each span provides details about a specific operation, such as the operation's name, start and end times,\nand any relevant [attributes](https://opentelemetry.io/docs/concepts/signals/traces/#attributes), within the request. For example, the following JSON shows a single span that represents\na call to a large language model (LLM): \n\n {\n \"name\": \"llm\",\n \"context\": {\n \"trace_id\": \"ed7b336d-e71a-46f0-a334-5f2e87cb6cfc\",\n \"span_id\": \"ad67332a-38bd-428e-9f62-538ba2fa90d4\"\n },\n \"span_kind\": \"LLM\",\n \"parent_id\": \"f89ebb7c-10f6-4bf8-8a74-57324d2556ef\",\n \"start_time\": \"2023-09-07T12:54:47.597121-06:00\",\n \"end_time\": \"2023-09-07T12:54:49.321811-06:00\",\n \"status_code\": \"OK\",\n \"status_message\": \"\",\n \"attributes\": {\n \"llm.input_messages\": [\n {\n \"message.role\": \"system\",\n \"message.content\": \"You are an expert Q&A system that is trusted around the world.\\nAlways answer the query using the provided context information, and not prior knowledge.\\nSome rules to follow:\\n1. Never directly reference the given context in your answer.\\n2. Avoid statements like 'Based on the context, ...' or 'The context information ...' or anything along those lines.\"\n },\n {\n \"message.role\": \"user\",\n \"message.content\": \"Hello?\"\n }\n ],\n \"output.value\": \"assistant: Yes I am here\",\n \"output.mime_type\": \"text/plain\"\n },\n \"events\": [],\n }\n\n| **Note:** The format of the trace(s) and span(s) depends on the instrumentation option you go with. The example span is experimental and subject to change so you shouldn't rely on the format to be stable for now. For details, see the [Semantic Conventions for Generative AI systems](https://opentelemetry.io/docs/specs/semconv/gen-ai/) being developed in OpenTelemetry.\n\nFor details, see the Cloud Trace documentation on\n[Traces and spans](/trace/docs/traces-and-spans) and\n[Trace context](/trace/docs/trace-context).\n\nWrite traces for an agent\n-------------------------\n\nTo write traces for an agent: \n\n### ADK\n\nTo enable tracing for `AdkApp`, specify `enable_tracing=True` when you\n[develop an Agent Development Kit agent](/vertex-ai/generative-ai/docs/agent-engine/develop/adk).\nFor example: \n\n from vertexai.preview.reasoning_engines import AdkApp\n from google.adk.agents import Agent\n\n agent = Agent(\n model=model,\n name=agent_name,\n tools=[get_exchange_rate],\n )\n\n app = AdkApp(\n agent=agent, # Required.\n enable_tracing=True, # Optional.\n )\n\n### LangchainAgent\n\nTo enable tracing for `LangchainAgent`, specify `enable_tracing=True` when you\n[develop a LangChain agent](/vertex-ai/generative-ai/docs/agent-engine/develop/langchain).\nFor example: \n\n from vertexai.preview.reasoning_engines import LangchainAgent\n\n agent = LangchainAgent(\n model=model, # Required.\n tools=[get_exchange_rate], # Optional.\n enable_tracing=True, # [New] Optional.\n )\n\n### LanggraphAgent\n\nTo enable tracing for `LanggraphAgent`, specify `enable_tracing=True` when you\n[develop a LangGraph agent](/vertex-ai/generative-ai/docs/agent-engine/develop/langgraph).\nFor example: \n\n from vertexai.preview.reasoning_engines import LanggraphAgent\n\n agent = LanggraphAgent(\n model=model, # Required.\n tools=[get_exchange_rate], # Optional.\n enable_tracing=True, # [New] Optional.\n )\n\n### LlamaIndex\n\n\n| **Preview**\n|\n|\n| This feature is subject to the \"Pre-GA Offerings Terms\" in the General Service Terms section\n| of the [Service Specific Terms](/terms/service-terms#1).\n|\n| Pre-GA features are available \"as is\" and might have limited support.\n|\n| For more information, see the\n| [launch stage descriptions](/products#product-launch-stages).\n\n\u003cbr /\u003e\n\nTo enable tracing for `LlamaIndexQueryPipelineAgent`, specify `enable_tracing=True` when you\n[develop a LlamaIndex agent](/vertex-ai/generative-ai/docs/agent-engine/develop/llama-index/query-pipeline).\nFor example: \n\n from vertexai.preview import reasoning_engines\n\n def runnable_with_tools_builder(model, runnable_kwargs=None, **kwargs):\n from llama_index.core.query_pipeline import QueryPipeline\n from llama_index.core.tools import FunctionTool\n from llama_index.core.agent import ReActAgent\n\n llama_index_tools = []\n for tool in runnable_kwargs.get(\"tools\"):\n llama_index_tools.append(FunctionTool.from_defaults(tool))\n agent = ReActAgent.from_tools(llama_index_tools, llm=model, verbose=True)\n return QueryPipeline(modules = {\"agent\": agent})\n\n agent = reasoning_engines.LlamaIndexQueryPipelineAgent(\n model=\"gemini-2.0-flash\",\n runnable_kwargs={\"tools\": [get_exchange_rate]},\n runnable_builder=runnable_with_tools_builder,\n enable_tracing=True, # Optional\n )\n\n### Custom\n\nTo enable tracing for [custom agents](/vertex-ai/generative-ai/docs/agent-engine/develop/custom),\nvisit [Tracing using OpenTelemetry](/vertex-ai/generative-ai/docs/agent-engine/develop/custom#tracing)\nfor details.\n\nThis will export traces to Cloud Trace under the project in\n[Set up your Google Cloud project](/vertex-ai/generative-ai/docs/agent-engine/set-up#project).\n\nView traces for an agent\n------------------------\n\nYou can view your traces using the [Trace Explorer](/trace/docs/finding-traces):\n\n1. To get the permissions to view trace data in the Google Cloud console or\n select a trace scope, ask your administrator to grant you the\n [Cloud Trace User](/iam/docs/understanding-roles#cloudtrace.user)\n (`roles/cloudtrace.user`) IAM role on your project.\n\n2. Go to **Trace Explorer** in the Google Cloud console:\n\n [Go to the Trace Explorer](https://console.cloud.google.com/traces/list)\n3. Select your Google Cloud project (corresponding to \u003cvar translate=\"no\"\u003ePROJECT_ID\u003c/var\u003e)\n at the top of the page.\n\nTo learn more, see the [Cloud Trace documentation](/trace/docs/finding-traces).\n\nQuotas and limits\n-----------------\n\nSome attribute values might get truncated when they reach quota limits. For\nmore information, see [Cloud Trace Quota](/trace/docs/quotas).\n\nPricing\n-------\n\nCloud Trace has a free tier. For more information, see\n[Cloud Trace Pricing](/trace#pricing)."]]