Auf dieser Seite erfahren Sie, wie Sie Cloud Trace für Ihren Agent aktivieren und Traces ansehen, um Antwortzeiten von Anfragen und ausgeführte Vorgänge zu analysieren.
Ein Trace ist eine Zeitachse von Anfragen, während Ihr Agent auf jede Anfrage reagiert. Das folgende Gantt-Diagramm zeigt beispielsweise einen Beispiel-Trace aus einer LangchainAgent:
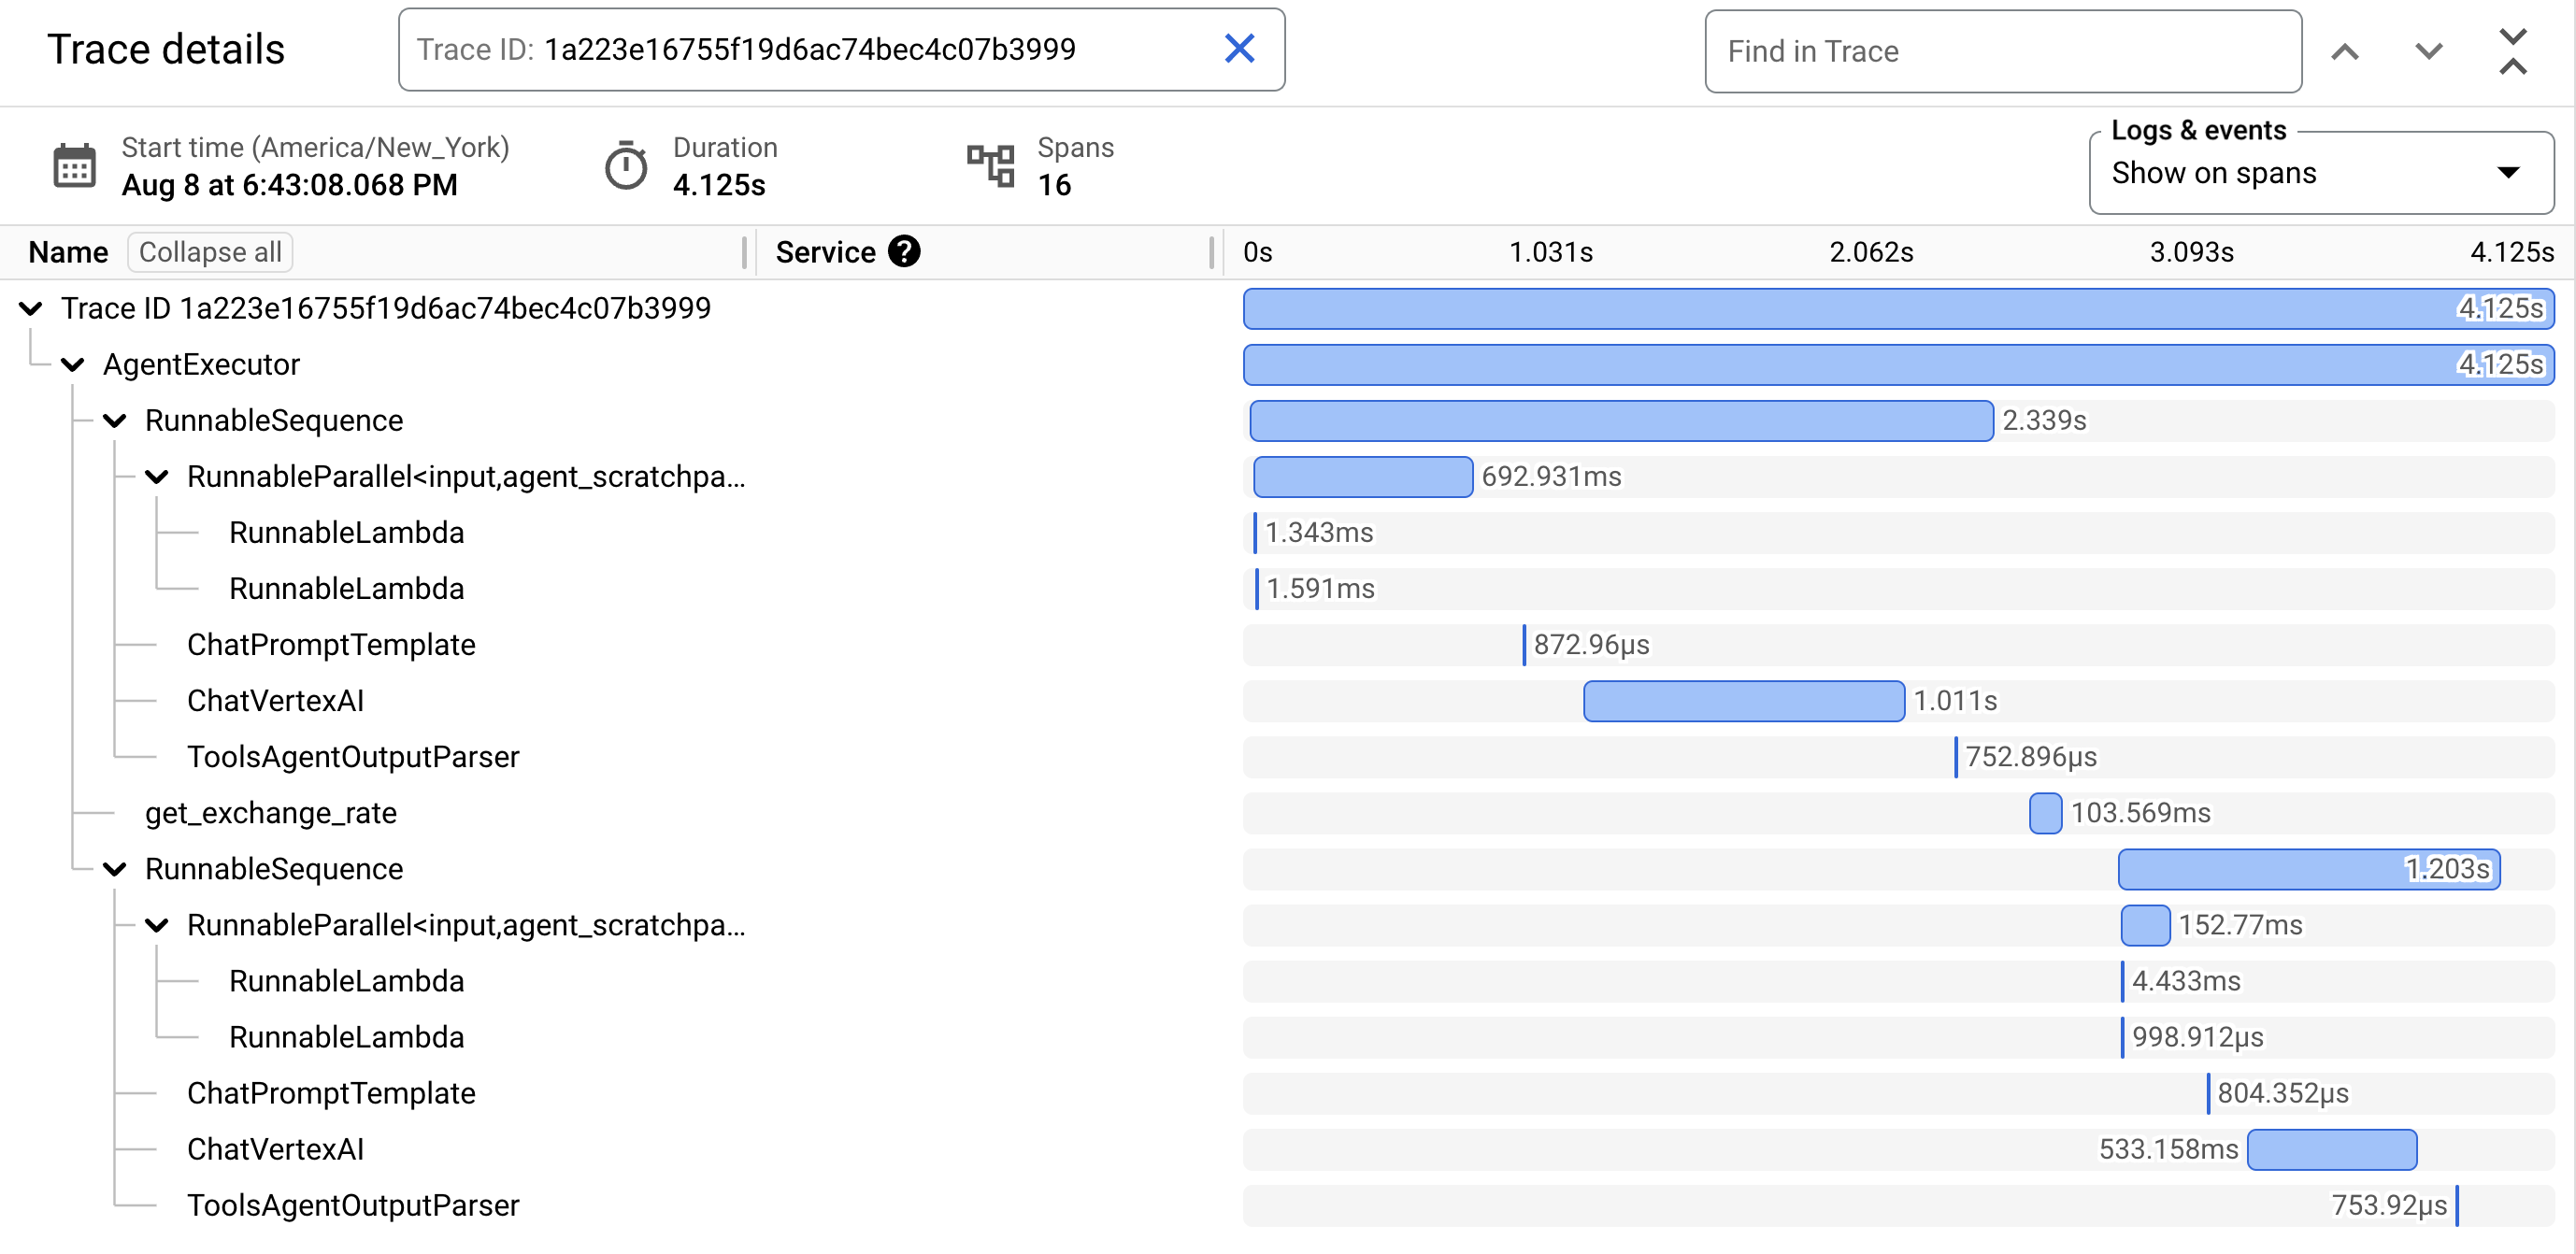
Die erste Zeile im Gantt-Diagramm steht für den Trace. Ein Trace besteht aus einzelnen Spans, die eine einzelne Arbeitseinheit wie einen Funktionsaufruf oder eine Interaktion mit einem LLM darstellen. Der erste Span repräsentiert die Gesamtanfrage. Jeder Span enthält Details zu einem bestimmten Vorgang, z. B. den Namen des Vorgangs, die Start- und Endzeiten sowie alle relevanten Attributen innerhalb der Anfrage. Das folgende JSON-Beispiel zeigt einen einzelnen Bereich, der einen Aufruf eines Large Language Model (LLM) darstellt:
  {
    "name": "llm",
    "context": {
        "trace_id": "ed7b336d-e71a-46f0-a334-5f2e87cb6cfc",
        "span_id": "ad67332a-38bd-428e-9f62-538ba2fa90d4"
    },
    "span_kind": "LLM",
    "parent_id": "f89ebb7c-10f6-4bf8-8a74-57324d2556ef",
    "start_time": "2023-09-07T12:54:47.597121-06:00",
    "end_time": "2023-09-07T12:54:49.321811-06:00",
    "status_code": "OK",
    "status_message": "",
    "attributes": {
        "llm.input_messages": [
            {
                "message.role": "system",
                "message.content": "You are an expert Q&A system that is trusted around the world.\nAlways answer the query using the provided context information, and not prior knowledge.\nSome rules to follow:\n1. Never directly reference the given context in your answer.\n2. Avoid statements like 'Based on the context, ...' or 'The context information ...' or anything along those lines."
            },
            {
                "message.role": "user",
                "message.content": "Hello?"
            }
        ],
        "output.value": "assistant: Yes I am here",
        "output.mime_type": "text/plain"
    },
    "events": [],
  }
Weitere Informationen finden Sie in der Cloud Trace-Dokumentation unter Traces und Spans und Trace-Kontext.
Traces für einen Agent schreiben
So schreiben Sie Traces für einen Agent:
ADK
Wenn Sie das Tracing für AdkApp aktivieren möchten, geben Sie enable_tracing=True an, wenn Sie einen Agent Development Kit-Agent entwickeln.
Beispiel:
  from vertexai.agent_engines import AdkApp
  from google.adk.agents import Agent

  agent = Agent(
      model=model,
      name=agent_name,
      tools=[get_exchange_rate],
  )

  app = AdkApp(
      agent=agent,          # Required.
      enable_tracing=True,  # Optional.
  )
LangchainAgent
Wenn Sie das Tracing für LangchainAgent aktivieren möchten, geben Sie enable_tracing=True an, wenn Sie einen LangChain-Agenten entwickeln.
Beispiel:
from vertexai.agent_engines import LangchainAgent

agent = LangchainAgent(
    model=model,                # Required.
    tools=[get_exchange_rate],  # Optional.
    enable_tracing=True,        # [New] Optional.
)
LanggraphAgent
Wenn Sie das Tracing für LanggraphAgent aktivieren möchten, geben Sie enable_tracing=True an, wenn Sie einen LangGraph-Agenten entwickeln.
Beispiel:
from vertexai.agent_engines import LanggraphAgent

agent = LanggraphAgent(
    model=model,                # Required.
    tools=[get_exchange_rate],  # Optional.
    enable_tracing=True,        # [New] Optional.
)
LlamaIndex
Wenn Sie das Tracing für LlamaIndexQueryPipelineAgent aktivieren möchten, geben Sie enable_tracing=True an, wenn Sie einen LlamaIndex-Agent entwickeln.
Beispiel:
from vertexai.preview import reasoning_engines

  def runnable_with_tools_builder(model, runnable_kwargs=None, **kwargs):
      from llama_index.core.query_pipeline import QueryPipeline
      from llama_index.core.tools import FunctionTool
      from llama_index.core.agent import ReActAgent

      llama_index_tools = []
      for tool in runnable_kwargs.get("tools"):
          llama_index_tools.append(FunctionTool.from_defaults(tool))
      agent = ReActAgent.from_tools(llama_index_tools, llm=model, verbose=True)
      return QueryPipeline(modules = {"agent": agent})

  agent = reasoning_engines.LlamaIndexQueryPipelineAgent(
      model="gemini-2.0-flash",
      runnable_kwargs={"tools": [get_exchange_rate]},
      runnable_builder=runnable_with_tools_builder,
      enable_tracing=True,        # Optional
  )
Benutzerdefiniert
Informationen zum Aktivieren des Tracings für benutzerdefinierte Agents finden Sie unter Tracing mit OpenTelemetry.
Dadurch werden Traces unter dem Projekt in Google Cloud -Projekt einrichten in Cloud Trace exportiert.
Traces für einen Agent ansehen
Sie können Ihre Traces mit dem Trace Explorer aufrufen:
Bitten Sie Ihren Administrator, Ihnen die IAM-Rolle Cloud Trace User (
roles/cloudtrace.user) für Ihr Projekt zuzuweisen, um die Berechtigungen zum Aufrufen von Trace-Daten in der Google Cloud Console oder zum Auswählen eines Trace-Bereichs zu erhalten.Rufen Sie in der Google Cloud Console den Trace Explorer auf:
Wählen Sie oben auf der Seite Ihr Google Cloud -Projekt (entsprechend
PROJECT_ID) aus.
Weitere Informationen finden Sie in der Cloud Trace-Dokumentation.
Kontingente und Limits
Einige Attributwerte werden möglicherweise gekürzt, wenn das Kontingentlimit erreicht wird. Weitere Informationen finden Sie unter Cloud Trace-Kontingent.
Preise
Cloud Trace ist in einer kostenlosen Stufe verfügbar. Weitere Informationen finden Sie unter Cloud Trace-Preise.