Mit Sammlungen den Überblick behalten
Sie können Inhalte basierend auf Ihren Einstellungen speichern und kategorisieren.
Auf dieser Seite wird beschrieben, wie Sie mit Cloud Monitoring und Spanner-Prüfprotokollen die Nutzung von Spanner Data Boost überwachen und analysieren.
Mit Cloud Monitoring können Sie die Gesamtnutzung im Zeitverlauf verfolgen und nach Nutzer aufschlüsseln. Spanner-Audit-Logs ermöglichen eine flexiblere Nutzungsanalyse, einschließlich der Bereitstellung von Messwerten nach Nutzer oder nach BigQuery-Job-ID.
Cloud Monitoring verwenden, um die Data Boost-Nutzung zu verfolgen
So verfolgen Sie die Gesamtnutzung von Data Boost:
Rufen Sie in der Google Cloud Console Monitoring auf. Zu „Monitoring“
Wenn der Metrics Explorer im Navigationsmenü angezeigt wird, wählen Sie ihn aus.
Klicken Sie andernfalls auf Ressourcen und wählen Sie dann Metrics Explorer aus.
Wählen Sie oben auf der Seite ein Zeitintervall aus.
Geben Sie in der Drop-down-Liste Messwert im Feld Nach Ressourcen- oder Messwertname filtern den Wert spanner ein und drücken Sie Enter, um die Suche einzugrenzen.
Wählen Sie in der Liste Messwert die Option Cloud Spanner-Instanz > Instanz > Verarbeitungseinheit (Sekunde) aus und klicken Sie dann auf Übernehmen.
So wird ein Liniendiagramm der aggregierten Data Boost-Nutzung für alle Spanner-Instanzen erstellt.
So rufen Sie die Nutzung für eine bestimmte Instanz auf:
Verwenden Sie das Feld Filter, um Filter wie die Instanz-ID hinzuzufügen.
Klicken Sie auf +, um weitere Attribute hinzuzufügen.
So rufen Sie eine Aufschlüsselung der Nutzung nach allen Instanzen auf:
Entfernen Sie alle Filter, indem Sie neben den Filterfeldern auf das Symbol X klicken.
Wählen Sie in der Drop-down-Liste für den Operator Aggregation die Option Summe und dann instance_id aus.
Wenn Sie die Nutzung nach Prinzipal aufschlüsseln möchten, wählen Sie im Drop-down-Menü Aggregation die Option Summe und dann credential_id aus.
Audit-Logs zur Analyse der Data Boost-Nutzung verwenden
Spanner-Audit-Logs ermöglichen eine flexiblere Analyse der Data Boost-Nutzung. Zusätzlich zur Möglichkeit, die Nutzung im Zeitverlauf nach Instanz oder Prinzipal aufzuschlüsseln, wie bei Cloud Monitoring, können Spanner-Audit-Logs, sofern aktiviert und verfügbar, die Nutzung im Zeitverlauf nach Datenbank oder BigQuery-Job-ID aufschlüsseln.
Sie müssen Audit-Logs zum Datenzugriff für Spanner aktivieren, bevor Sie Nutzungsdaten für Data Boost erfassen können. Führen Sie dazu die folgenden Schritte aus:
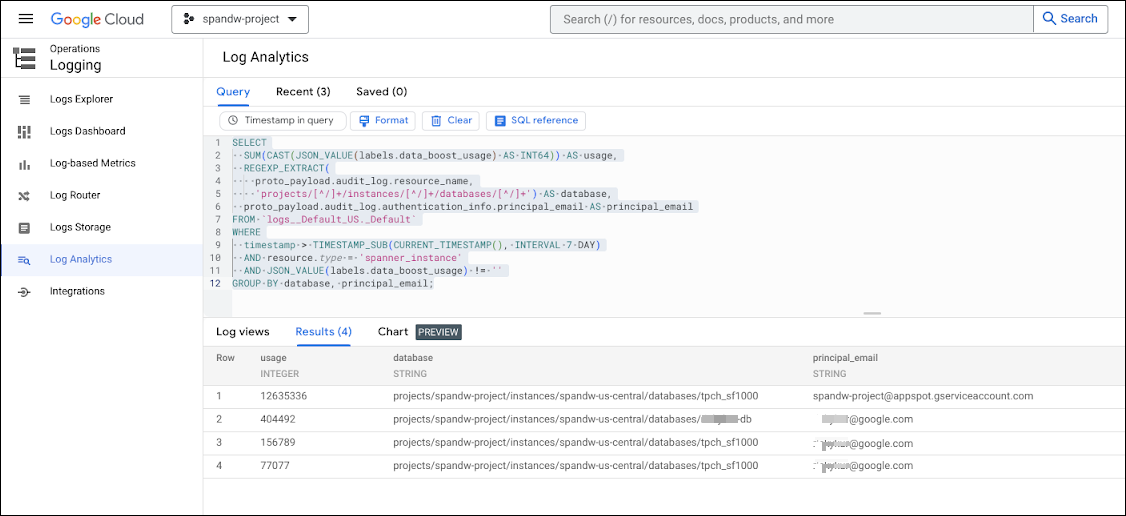
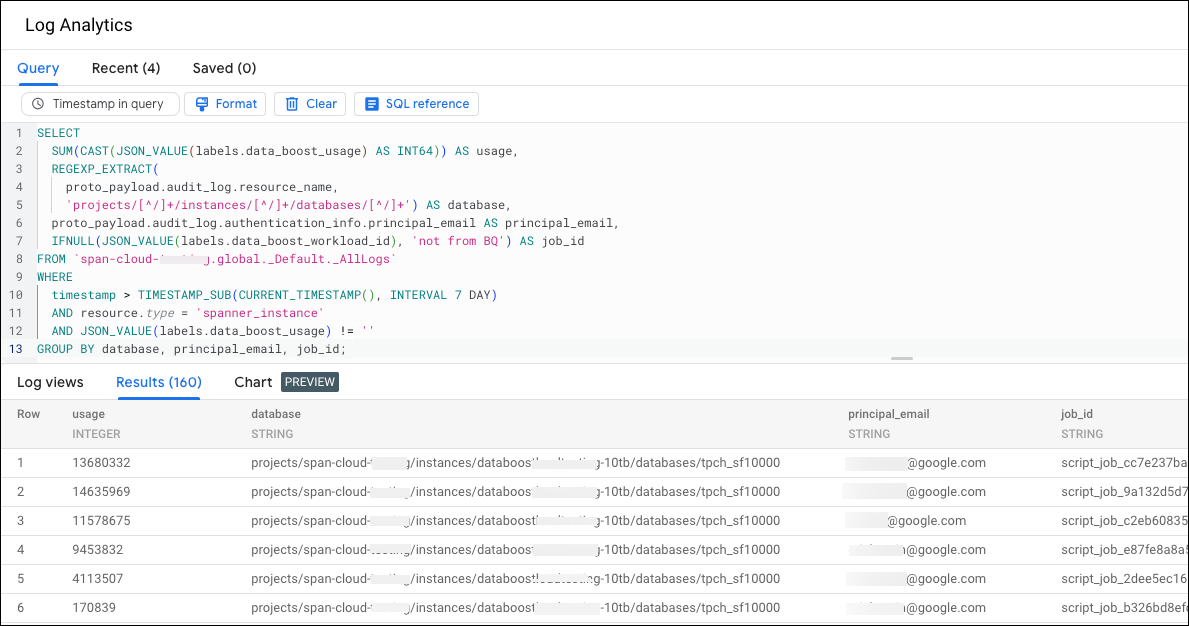
Führen Sie die folgende Abfrage aus, um die Nutzung nach Nutzer und Datenbank in den letzten 7 Tagen aufzuschlüsseln. Wenn Sie den Zeitraum ändern möchten, für den die Nutzung angezeigt wird, ändern Sie den timestamp-Ausdruck in der WHERE-Klausel.
SELECTSUM(CAST(JSON_VALUE(labels.data_boost_usage)ASINT64))ASusage,REGEXP_EXTRACT(proto_payload.audit_log.resource_name,'projects/[^/]+/instances/[^/]+/databases/[^/]+')ASdatabase,proto_payload.audit_log.authentication_info.principal_emailASprincipal_email,IFNULL(JSON_VALUE(labels.data_boost_workload_id),'not from BQ')ASjob_idFROM`PROJECT_NAME.global._Default._AllLogs`WHEREtimestamp > TIMESTAMP_SUB(CURRENT_TIMESTAMP(),INTERVAL7DAY)ANDresource.type='spanner_instance'ANDoperation.lastISNULLANDJSON_VALUE(labels.data_boost_usage)!=''GROUPBYdatabase,principal_email,job_id;
Ersetzen Sie PROJECT_NAME durch Ihren Projektnamen.
Im folgenden Beispiel wird die Nutzung nach BigQuery-Job-ID dargestellt.
Nutzung nach BigQuery SQL-Text ansehen
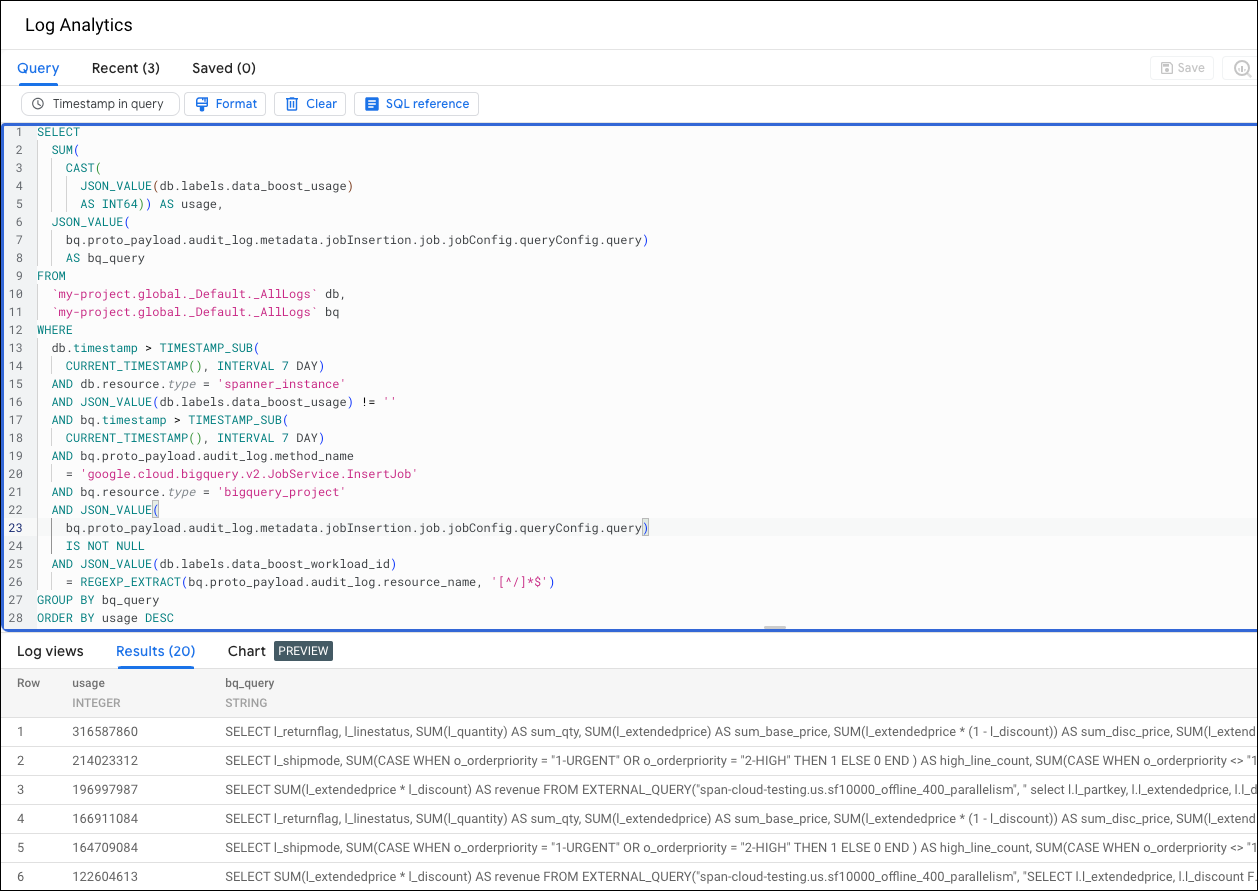
So rufen Sie die Data Boost-Nutzung für mehrere BigQuery-Jobs auf, die nach dem SQL-Text dieser Jobs zusammengefasst werden:
Rufen Sie in der Google Cloud Console den Log-Explorer auf.
Ersetzen Sie PROJECT_NAME durch Ihren Projektnamen.
Im folgenden Beispiel sehen Sie die Verwendung von Data Boost nach SQL-Text.
Data Boost-Benachrichtigung erstellen
Informationen zum Erstellen einer Benachrichtigung, die ausgegeben wird, wenn die Data Boost-Nutzung einen vordefinierten Grenzwert überschreitet, finden Sie unter Benachrichtigung für Data Boost-Nutzung festlegen.
[[["Leicht verständlich","easyToUnderstand","thumb-up"],["Mein Problem wurde gelöst","solvedMyProblem","thumb-up"],["Sonstiges","otherUp","thumb-up"]],[["Schwer verständlich","hardToUnderstand","thumb-down"],["Informationen oder Beispielcode falsch","incorrectInformationOrSampleCode","thumb-down"],["Benötigte Informationen/Beispiele nicht gefunden","missingTheInformationSamplesINeed","thumb-down"],["Problem mit der Übersetzung","translationIssue","thumb-down"],["Sonstiges","otherDown","thumb-down"]],["Zuletzt aktualisiert: 2025-08-11 (UTC)."],[],[],null,["# Monitor Data Boost usage\n\n\u003cbr /\u003e\n\nThis page describes how to use Cloud Monitoring and Spanner audit\nlogs to monitor and analyze Spanner Data Boost usage.\n\nCloud Monitoring provides the ability to track total usage over time and to\nbreak down that usage by user. Spanner audit logs allow more\nflexible usage analysis, including providing metrics by user or by\nBigQuery job ID.\n\nUse Cloud Monitoring to track Data Boost usage\n----------------------------------------------\n\nFollow these steps to track overall Data Boost usage:\n\n1. In the Google Cloud console, go to **Monitoring** . \n [Go to Monitoring](https://console.cloud.google.com/monitoring)\n2. If **Metrics Explorer** is shown in the navigation menu, select it. Otherwise, click **Resources** , and then select **Metrics Explorer**.\n3. At the top of the page, select a time interval.\n4. In the **Metric** drop-down list, in the **Filter by resource or metric\n name** field, enter `spanner` and press `Enter` to narrow the search.\n5. In the **Metric** list, select **Cloud Spanner Instance \\\u003e Instance \\\u003e\n Processing unit second** , and then click **Apply**.\n\n This creates a line chart of aggregate Data Boost usage across\n all Spanner instances.\n6. To view usage for a particular instance, follow these steps:\n\n 1. Use the **Filter** field to add filters, such as the instance ID.\n 2. Click **+** to add other attributes.\n7. To view a breakdown of usage by all instances, follow these steps:\n\n 1. Clear any filters by clicking the **X** icon next to the filter fields.\n 2. In the **Aggregation** operator drop-down list, select **Sum** , and then select by **instance_id**.\n8. To break down usage by principal, in the **Aggregation** operator drop-down,\n select **Sum** , and then select by **credential_id**.\n\nUse audit logs to analyze Data Boost usage\n------------------------------------------\n\nSpanner audit logs allow more flexible analysis of\nData Boost usage. In addition to the ability to break down usage\nover time by instance or principal as with Cloud Monitoring,\nSpanner audit logs, if enabled and available, allow breaking down\nusage over time by database or BigQuery job ID.\n\nEnabling audit logs can incur extra charges. For information about\nLogging pricing, see\n[Google Cloud Observability pricing: Cloud Logging](https://cloud.google.com/stackdriver/pricing#logging-costs).\n\n### Enable Data Boost usage audit logs\n\nYou must enable data access audit logs for Spanner before you can\ncollect usage data for Data Boost. To do so, follow these steps:\n\n1. Follow the instructions in [Configure Data Access audit logs with the Google Cloud console](/logging/docs/audit/configure-data-access#config-console).\n2. Enable the **Data Read** log type for the **Spanner API** service.\n3. To obtain Data Boost usage by BigQuery job SQL text, ensure that that the audit logs for BigQuery are enabled as well.\n\n### View usage by principal\n\nTo query the audit logs to view Data Boost usage by user, follow\nthese steps:\n\n1. Go to the Logs Explorer in the Google Cloud console.\n\n [Go to Logs Explorer](https://console.cloud.google.com/logs)\n2. In the navigation menu, click **Log Analytics**.\n\n3. To show usage by user and database over the past 7 days, run the following\n query. To change the timespan for which usage is shown, modify the\n `timestamp` expression in the `WHERE` clause.\n\n SELECT\n SUM(CAST(JSON_VALUE(labels.data_boost_usage) AS INT64)) AS usage,\n REGEXP_EXTRACT(\n proto_payload.audit_log.resource_name,\n 'projects/[^/]+/instances/[^/]+/databases/[^/]+') AS database,\n proto_payload.audit_log.authentication_info.principal_email AS principal_email\n FROM `\u003cvar translate=\"no\"\u003e\u003cspan class=\"devsite-syntax-n\"\u003ePROJECT_NAME\u003c/span\u003e\u003c/var\u003e.global._Default._AllLogs`\n WHERE\n timestamp \u003e TIMESTAMP_SUB(CURRENT_TIMESTAMP(), INTERVAL 7 DAY)\n AND resource.type = 'spanner_instance' AND operation.last IS NULL\n AND JSON_VALUE(labels.data_boost_usage) != ''\n GROUP BY database, principal_email;\n\n Replace \u003cvar translate=\"no\"\u003ePROJECT_NAME\u003c/var\u003e with your project name.\n\nThe following example shows usage in processing units for 4 principals.\n\n### View usage by BigQuery job ID\n\nTo query the audit logs to view Data Boost usage broken down by\ndatabase, user, and BigQuery job ID, follow these steps:\n\n1. Go to the Logs Explorer in the Google Cloud console.\n\n [Go to Logs Explorer](https://console.cloud.google.com/logs)\n2. In the navigation menu, click **Log Analytics**.\n\n3. Run the following query:\n\n SELECT\n SUM(CAST(JSON_VALUE(labels.data_boost_usage) AS INT64)) AS usage,\n REGEXP_EXTRACT(\n proto_payload.audit_log.resource_name,\n 'projects/[^/]+/instances/[^/]+/databases/[^/]+') AS database,\n proto_payload.audit_log.authentication_info.principal_email AS principal_email,\n IFNULL(JSON_VALUE(labels.data_boost_workload_id), 'not from BQ') AS job_id\n FROM `\u003cvar translate=\"no\"\u003e\u003cspan class=\"devsite-syntax-n\"\u003ePROJECT_NAME\u003c/span\u003e\u003c/var\u003e.global._Default._AllLogs`\n WHERE\n timestamp \u003e TIMESTAMP_SUB(CURRENT_TIMESTAMP(), INTERVAL 7 DAY)\n AND resource.type = 'spanner_instance' AND operation.last IS NULL\n AND JSON_VALUE(labels.data_boost_usage) != ''\n GROUP BY database, principal_email, job_id;\n\n Replace \u003cvar translate=\"no\"\u003ePROJECT_NAME\u003c/var\u003e with your project name.\n\nThe following example shows usage by BigQuery job ID.\n\n### View usage by BigQuery SQL text\n\nTo view Data Boost usage for multiple BigQuery jobs\naggregated by the SQL text of those jobs, follow these steps:\n\n1. Go to the Logs Explorer in the Google Cloud console.\n\n [Go to Logs Explorer](https://console.cloud.google.com/logs)\n2. In the navigation menu, click **Log Analytics**.\n\n3. Run the following query:\n\n SELECT\n SUM(\n CAST(\n JSON_VALUE(db.labels.data_boost_usage)\n AS INT64)) AS usage,\n JSON_VALUE(\n bq.proto_payload.audit_log.metadata.jobInsertion.job.jobConfig.queryConfig.query)\n AS bq_query\n FROM\n `\u003cvar translate=\"no\"\u003e\u003cspan class=\"devsite-syntax-n\"\u003ePROJECT_NAME\u003c/span\u003e\u003c/var\u003e.global._Default._AllLogs` db,\n `\u003cvar translate=\"no\"\u003e\u003cspan class=\"devsite-syntax-n\"\u003ePROJECT_NAME\u003c/span\u003e\u003c/var\u003e.global._Default._AllLogs` bq\n WHERE\n db.timestamp \u003e TIMESTAMP_SUB(\n CURRENT_TIMESTAMP(), INTERVAL 7 DAY)\n AND db.resource.type = 'spanner_instance'\n AND JSON_VALUE(db.labels.data_boost_usage) != ''\n AND db.operation.last IS NULL\n AND bq.timestamp \u003e TIMESTAMP_SUB(\n CURRENT_TIMESTAMP(), INTERVAL 7 DAY)\n AND bq.proto_payload.audit_log.method_name\n = 'google.cloud.bigquery.v2.JobService.InsertJob'\n AND bq.resource.type = 'bigquery_project'\n AND JSON_VALUE(\n bq.proto_payload.audit_log.metadata.jobInsertion.job.jobConfig.queryConfig.query)\n IS NOT NULL\n AND JSON_VALUE(db.labels.data_boost_workload_id)\n = REGEXP_EXTRACT(bq.proto_payload.audit_log.resource_name, '[^/]*$')\n GROUP BY bq_query\n ORDER BY usage DESC\n\n Replace \u003cvar translate=\"no\"\u003ePROJECT_NAME\u003c/var\u003e with your project name.\n\nThe following example shows Data Boost usage by SQL text.\n\nCreate a Data Boost alert\n-------------------------\n\nTo create an alert that is issued when Data Boost usage exceeds\na predefined threshold, see\n[Set an alert for Data Boost usage](/spanner/docs/databoost/databoost-quotas#databoost-alert).\n\nWhat's next\n-----------\n\n- Learn about Data Boost in [Data Boost overview](/spanner/docs/databoost/databoost-overview)."]]