Stay organized with collections
Save and categorize content based on your preferences.
View the consumption of each resource through the Billing reports dashboards.
These dashboards are available to track your resource consumption over a period
of time, and help you manage your resources effectively.
To get the permissions you need to view the Billing Usage dashboards, ask
your Organization IAM Admin to grant you the corresponding viewer role for your
project.
The Billing Usage dashboards consist of the following:
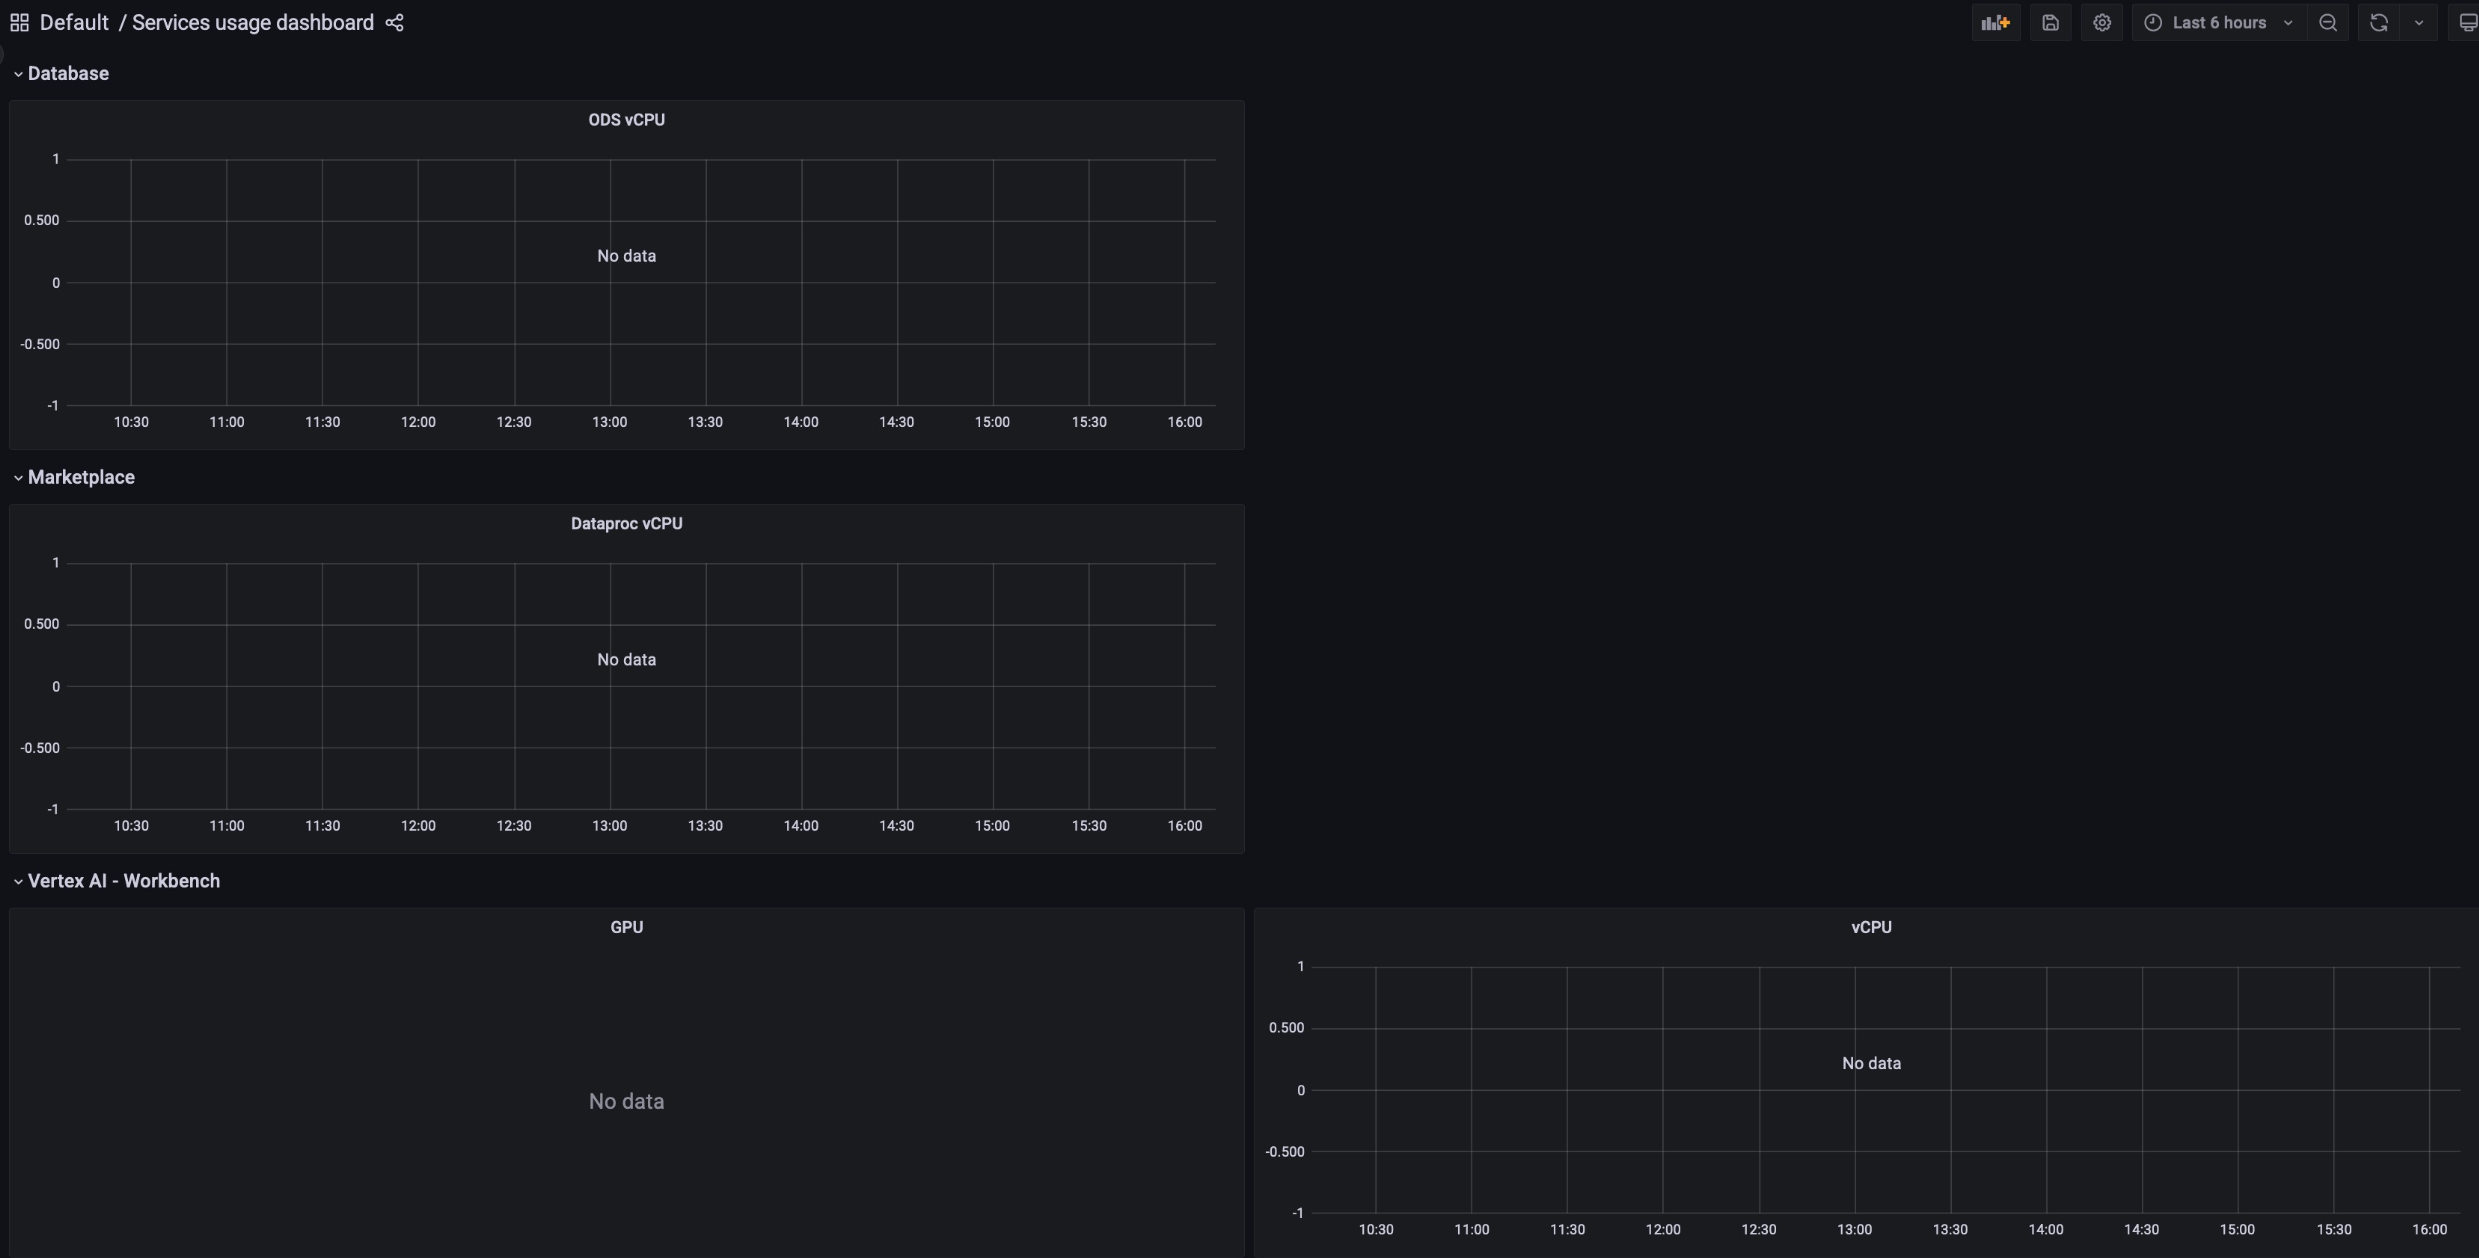
Storage Allocation: tracks how much resource usage a given service in your
project has consumed. Services include resources such as Backup,
Marketplace, Database Service, and Vertex AI.
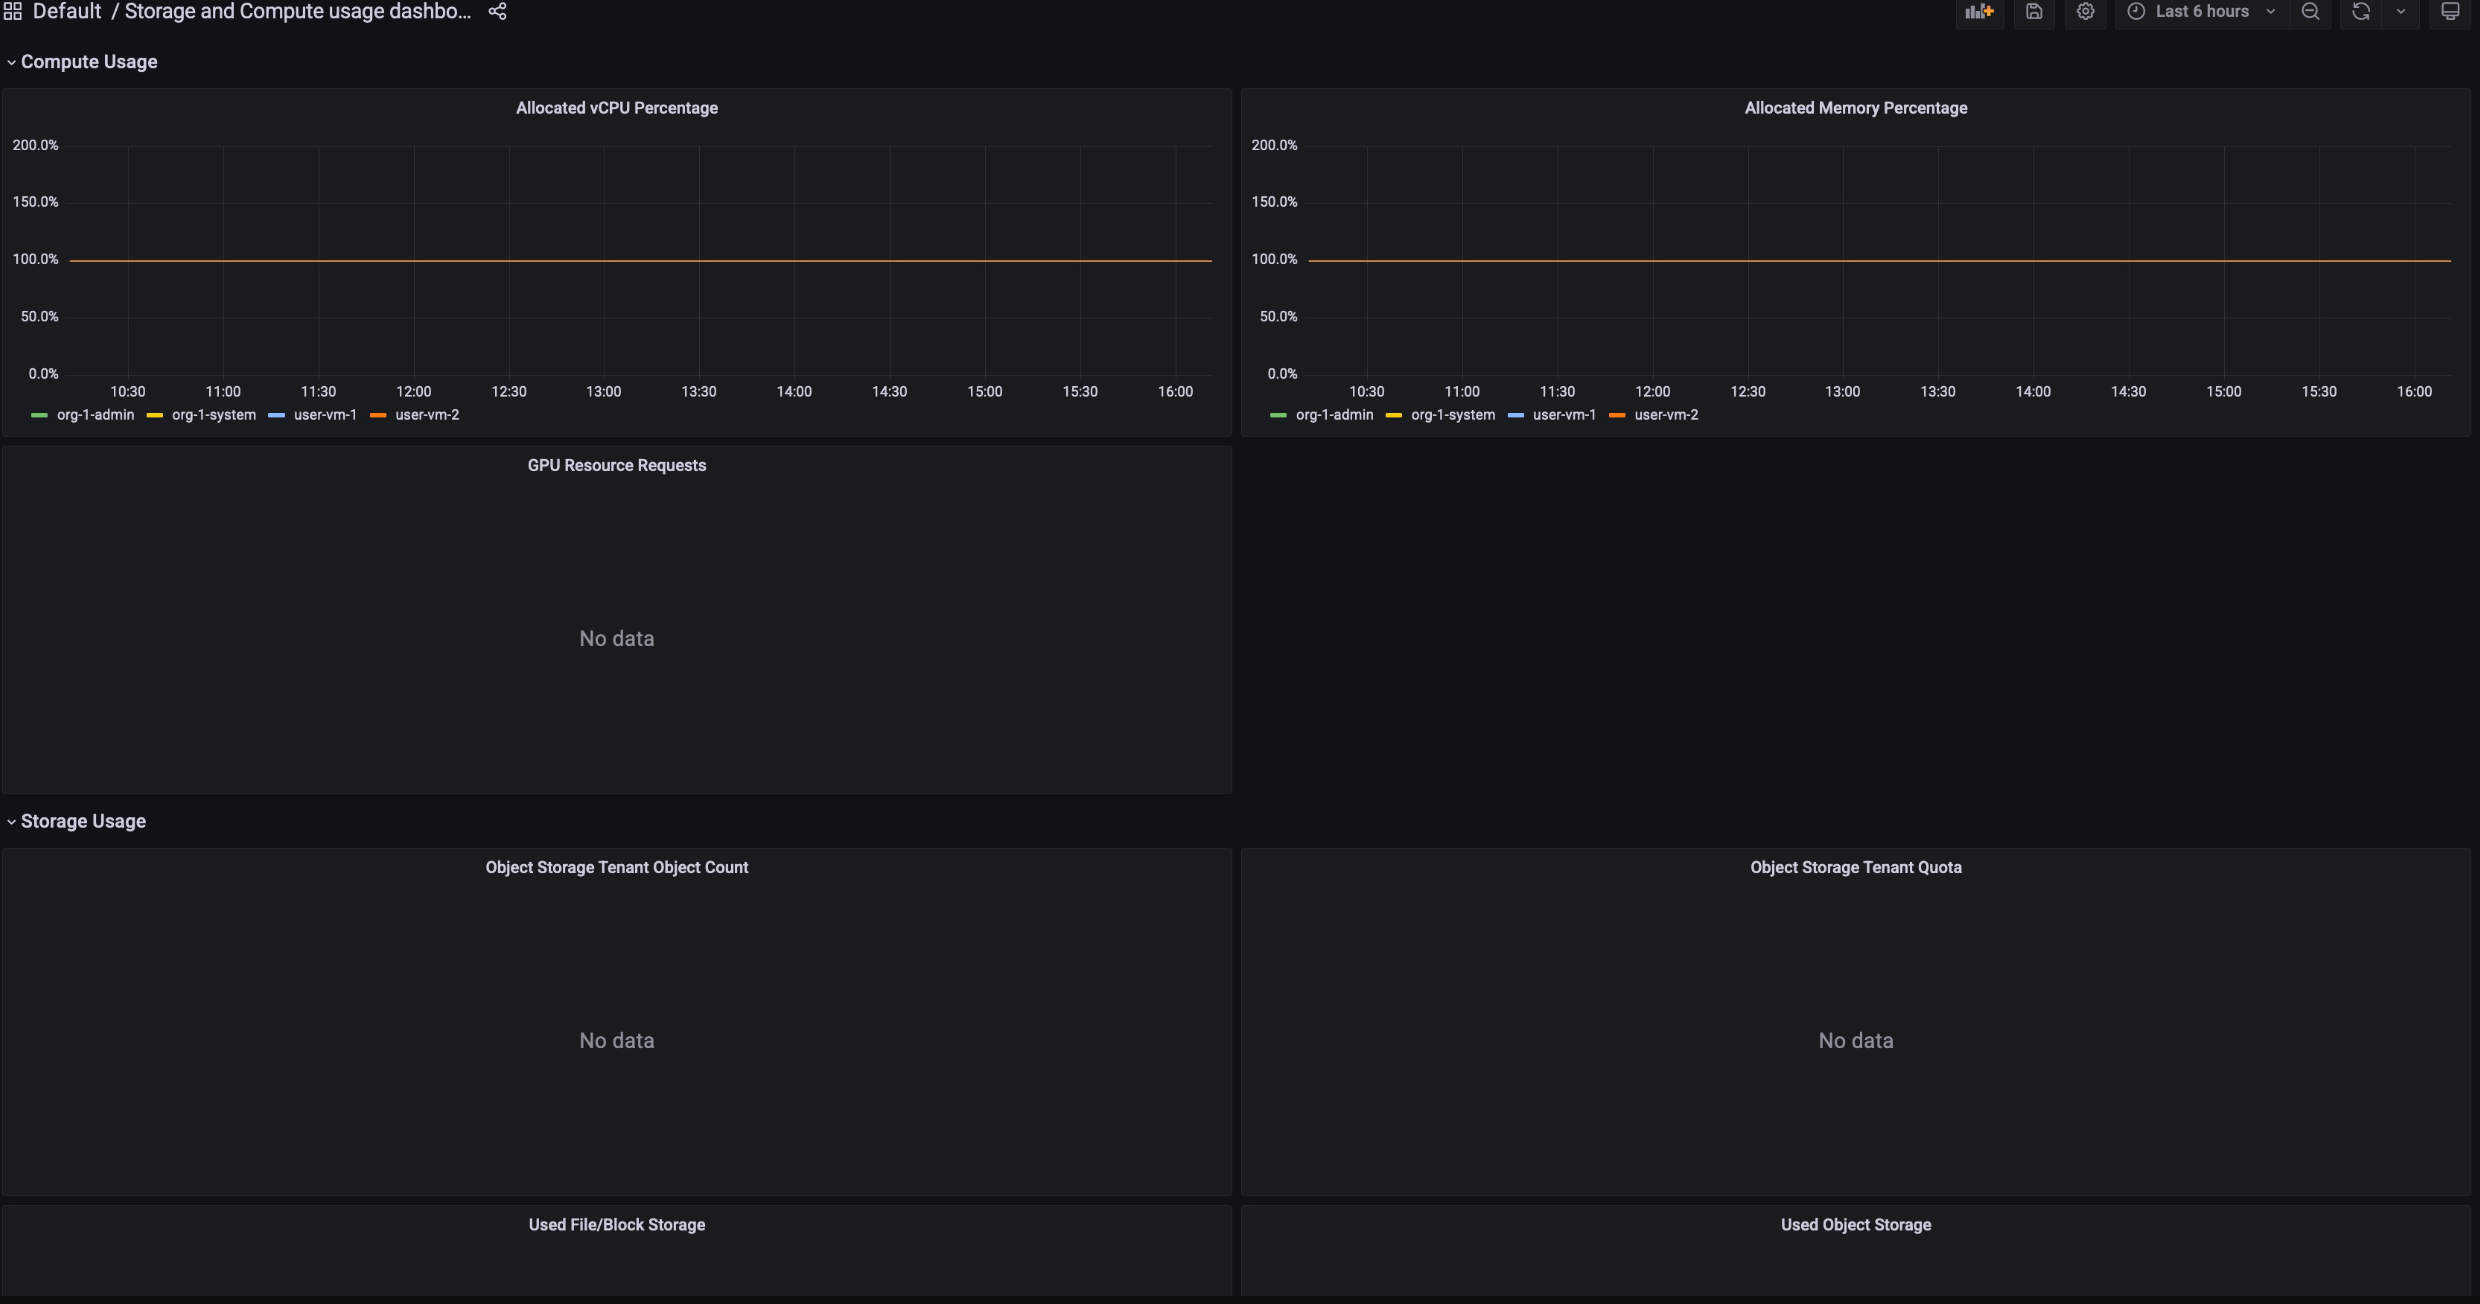
Compute Allocation: tracks the metrics of resource usage on
Storage and Compute services for a given period of time. This dashboard is
available for monitoring purposes.
To view the Billing Usage dashboards, work through the following steps:
Sign in to the GDC console.
In the navigation menu, select Billing > Reports.
In the Billing reports page, select the service that you want to view.
For example, to view the metric consumption of the managed service,
Vertex AI, click either GPU or vCPU.
To view a certain period of time in a given dashboard, click the
Time drop-down in the menu bar. The Time drop-down defaults to show
the metrics of the last six hours.
[[["Easy to understand","easyToUnderstand","thumb-up"],["Solved my problem","solvedMyProblem","thumb-up"],["Other","otherUp","thumb-up"]],[["Hard to understand","hardToUnderstand","thumb-down"],["Incorrect information or sample code","incorrectInformationOrSampleCode","thumb-down"],["Missing the information/samples I need","missingTheInformationSamplesINeed","thumb-down"],["Other","otherDown","thumb-down"]],["Last updated 2025-08-29 UTC."],[[["\u003cp\u003eBilling reports dashboards allow you to track resource consumption over time for effective resource management.\u003c/p\u003e\n"],["\u003cp\u003eDashboards are available for both Storage Allocation and Compute Allocation, showing resource usage metrics for various services.\u003c/p\u003e\n"],["\u003cp\u003eTo view the dashboards, you must be granted the corresponding viewer role by your Organization IAM Admin.\u003c/p\u003e\n"],["\u003cp\u003eYou can view resource usage for specific services, such as Vertex AI, within the Billing reports page by selecting the desired service.\u003c/p\u003e\n"],["\u003cp\u003eThe dashboards display resource consumption metrics, which may not directly correspond to the final pricing shown on invoices.\u003c/p\u003e\n"]]],[],null,["# Review resource consumption\n\nView the consumption of each resource through the Billing reports dashboards.\nThese dashboards are available to track your resource consumption over a period\nof time, and help you manage your resources effectively.\n\nTo get the permissions you need to view the Billing Usage dashboards, ask\nyour Organization IAM Admin to grant you the corresponding viewer role for your\nproject.\n\nThe Billing Usage dashboards consist of the following:\n\n- **Storage Allocation**: tracks how much resource usage a given service in your\n project has consumed. Services include resources such as Backup,\n Marketplace, Database Service, and Vertex AI.\n\n | **Important:** Metrics in the Services Usage dashboard is not a direct mapping to the price you might see in the Invoice dashboard. For example, the quantity of consumption you see in the Services Usage dashboard might not match the quantity GDC used to calculate the price in the Invoice dashboard.\n- **Compute Allocation**: tracks the metrics of resource usage on\n Storage and Compute services for a given period of time. This dashboard is\n available for monitoring purposes.\n\nTo view the Billing Usage dashboards, work through the following steps:\n\n1. Sign in to the GDC console.\n2. In the navigation menu, select **Billing \\\u003e Reports**.\n3. In the **Billing reports** page, select the service that you want to view. For example, to view the metric consumption of the managed service, Vertex AI, click either `GPU` or `vCPU`.\n4. To view a certain period of time in a given dashboard, click the **Time** drop-down in the menu bar. The **Time** drop-down defaults to show the metrics of the last six hours."]]