Use flow logs to save network traffic metadata, including 5-tuples, in Google Distributed Cloud (GDC) air-gapped to the observability stack in the form of queryable logs. Use these logs to:
- Understand traffic flows for a particular service in an organization.
- Understand and identify issues with the network health of a Kubernetes workload.
- Verify Kubernetes network policies.
Flow log is a GDC feature based on the open source
Hubble project: https://github.com/cilium/hubble. Configure flow logs using
the FlowLog
resource from the
Networking API.
Before you begin
You must obtain authorization to manage or view flow logs from the GDC console. To manage flow logs, ask your Organization IAM Admin to grant you the Flow Log Admin (
flowlog-admin) role. To only view existing flow logs, ask your Organization IAM Admin to grant you the Flow Log Viewer (flowlog-viewer) role.For information about setting role bindings from the GDC console, see Grant access to resources.
Before querying and viewing flow logs on dashboards, you must obtain access to the monitoring instance. For more information, see Query and view metrics.
Create a flow log
Create a flow log to save network traffic metadata that is filtered by a given set of specifications.
Create flow log with protocol and namespace filters
Create a file called
example-flowlog.yamlwith the following contents:apiVersion: networking.gdc.goog/v1 kind: FlowLog metadata: name: "FLOW_LOG_NAME" namespace: "platform" spec: filters: - l4Protocols: - tcp source: namespacePodSelectors: - namespace: gpc-system - namespace: kube-system destination: namespacePodSelectors: - namespace: kube-system lifetime: duration: "1h"Replace
FLOW_LOG_NAMEwith the chosen name for the flow log.In this example, the flow log captures all flows for which a TCP connection was started by any pod in the
gpc-systemorkube-systemnamespace to any pod inkube-systemnamespace. It stops recording logs one hour from when the object is created.Create the flow log object:
kubectl --kubeconfig MANAGEMENT_API_SERVER apply -f example-flowlog.yamlReplace
MANAGEMENT_API_SERVERwith the zonal Management API server's kubeconfig path.Verify that the
FLOW_LOG_NAMEvalue was correctly reconciled, and that the logging process has started by examining theStatusfield:kubectl --kubeconfig MANAGEMENT_API_SERVER describe -n platform FLOW_LOG_NAMEExample status:
Status:
  Clusters:
    Cluster:  org-1-infra-cluster
    Conditions:
      Last Transition Time:  2024-01-19T01:46:11Z
      Message:
      Observed Generation:   1
      Reason:                ResourcesPropagated
      Status:                True
      Type:                  Propagated
    Name:                    cilium-flowlog-config
    Namespace:               kube-system
    Node:                    org-1-infra
    Cluster:                 user-vm-1-cluster
    Conditions:
      Last Transition Time:  2024-01-19T01:46:11Z
      Message:
      Observed Generation:   1
      Reason:                ResourcesPropagated
      Status:                True
      Type:                  Propagated
    Name:                    cilium-flowlog-config
    Namespace:               kube-system
    Node:                    user-vm-1
    Cluster:                 user-vm-2-cluster
    Conditions:
      Last Transition Time:  2024-01-19T01:46:11Z
      Message:
      Observed Generation:   1
      Reason:                ResourcesPropagated
      Status:                True
      Type:                  Propagated
    Name:                    cilium-flowlog-config
    Namespace:               kube-system
    Node:                    user-vm-2
  Conditions:
    Last Transition Time:  2024-01-18T19:17:53Z
    Message:
    Observed Generation:   1
    Reason:                Active
    Status:                True
    Type:                  Logging
    Last Transition Time:  2024-01-19T01:46:11Z
    Message:
    Observed Generation:   1
    Reason:                ResourcesPropagated
    Status:                True
    Type:                  Propagated
    Last Transition Time:  2024-01-18T19:17:53Z
    Message:
    Observed Generation:   1
    Reason:                Succeeded
    Status:                True
    Type:                  Reconciled
  Start Time:              2024-01-18T19:17:53Z
  End Time:              2024-01-18T20:17:53Z
This example output contains the following conditions:
Propagated: the flow log configuration was sent to clustersuser-vm-1,user-vm-2, andorg-1-infra.Reconciled: the flow log was successfully programmed on clustersuser-vm-1,user-vm-2, andorg-1-infra.Logging: the flow log is not expired or disabled, has not encountered any error, and may produce logs if the filters match the flows.- The
Start TimeandEnd Timeindicate the job was started at19:17:53, and expires at20:17:53.
For this flow log to be able to successfully produce log entries, all
Propagated,ReconciledandLoggingconditions must be true.
Modify flow log
To modify an existing flow log, modify the created flow log object definition in
the example-flowlog.yaml file and apply it again:
kubectl --kubeconfig MANAGEMENT_API_SERVER apply -f example-flowlog.yaml
View flow logs in monitor dashboard
Open the operational log dashboard. For more information, see Query operational logs.
Set the identifier drop-down value to
network-flow-logs, then click add json parser, and supply the following value to the query:{identifier="network-flow-logs"} | json: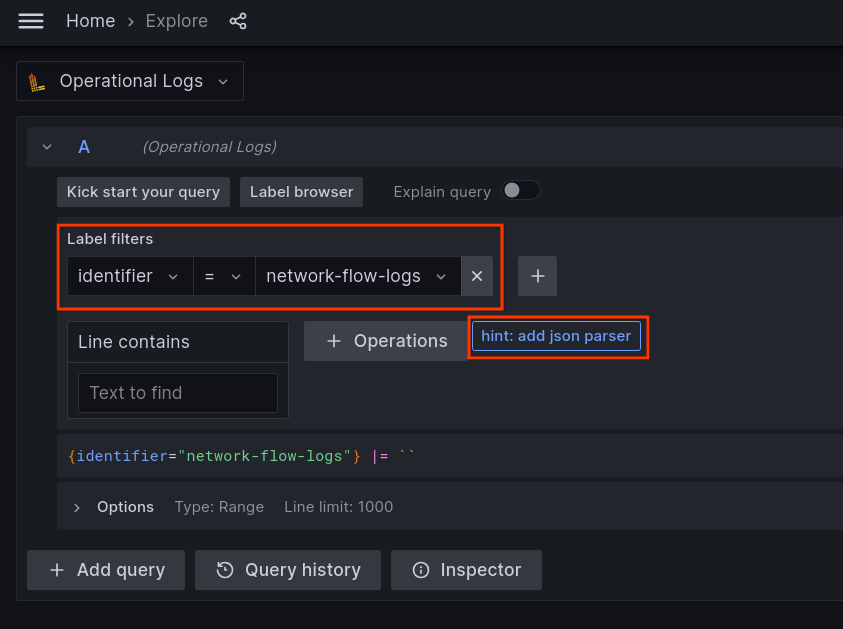
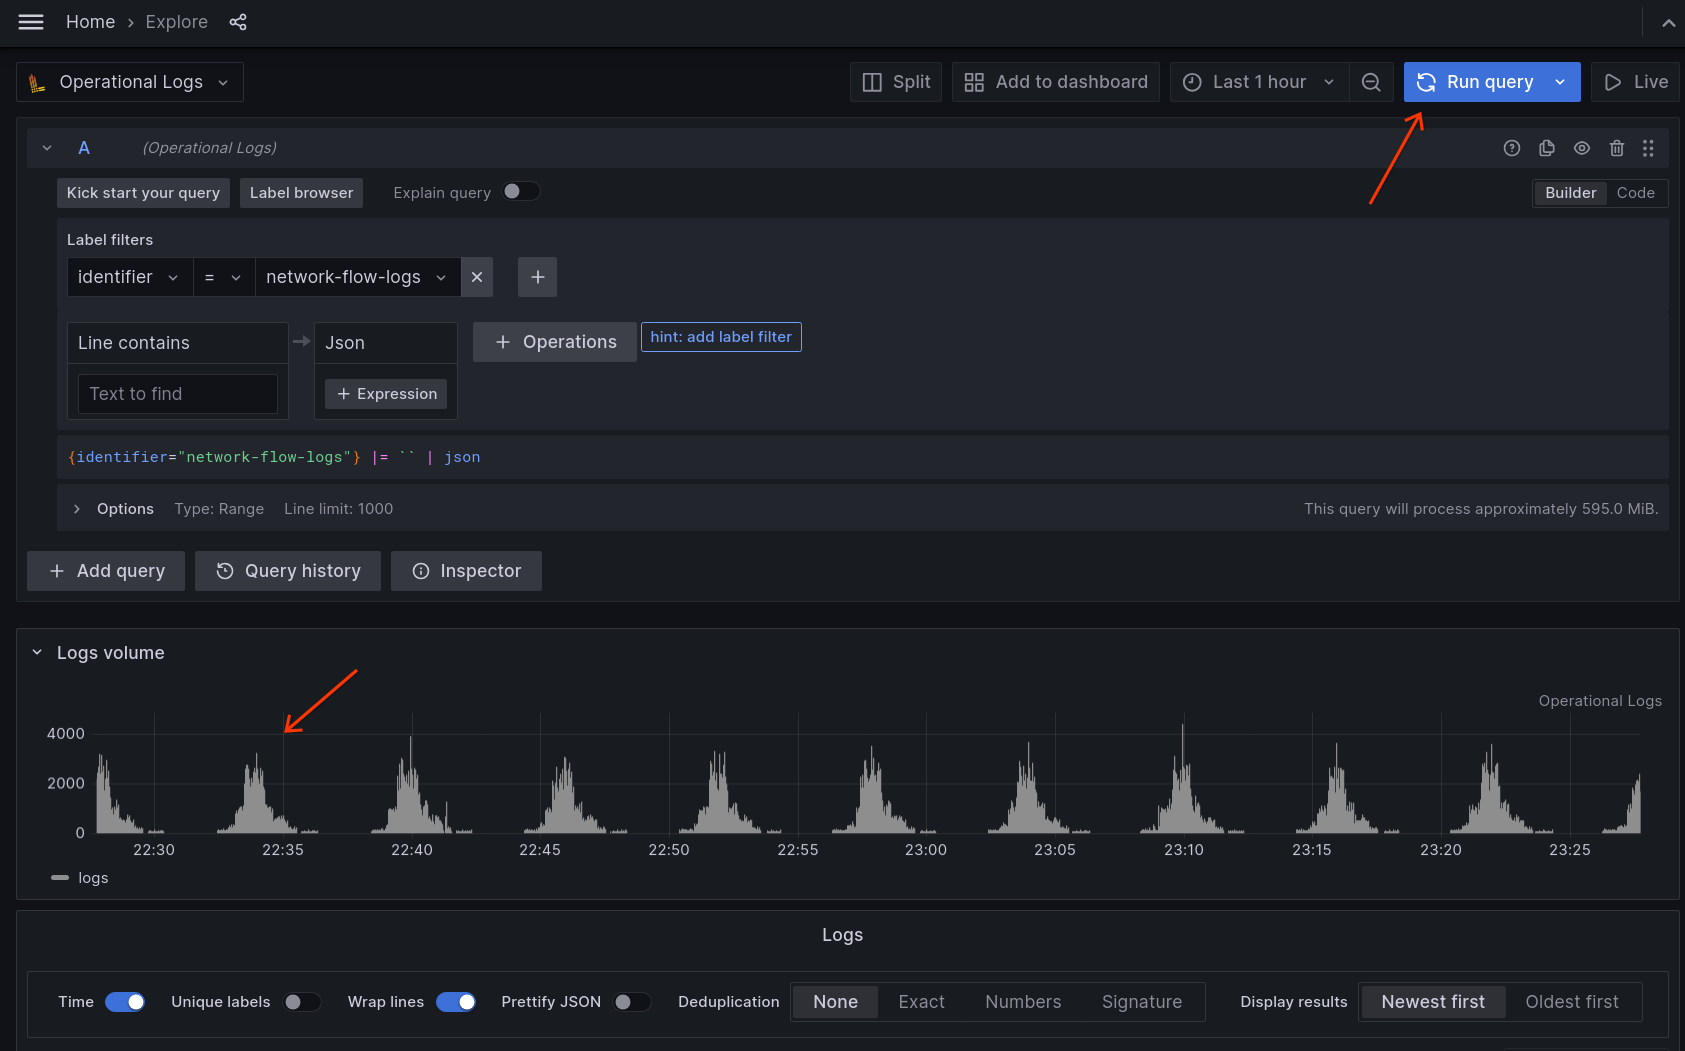
Click Run query. This shows the saved flow log entries:
Use the filters to further refine the results. For example, provide the cluster drop-down with a value of
user-vm-1to only look at flows collected from theuser-vm-1cluster: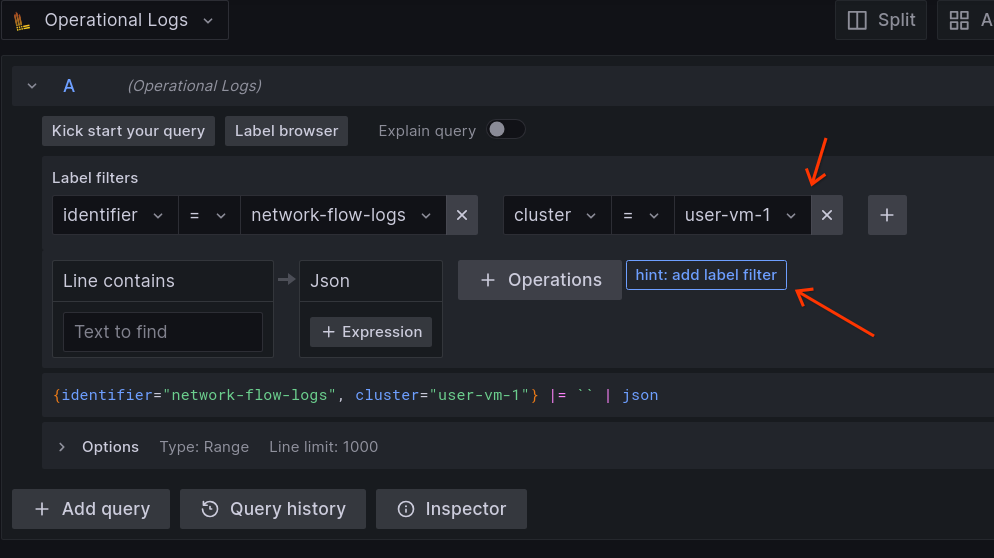
Browse flow log entries, expand the entry to look at the details, and add more label filters as needed using the shortcut icon. In this example, we want to further filter flows by its source IP address:
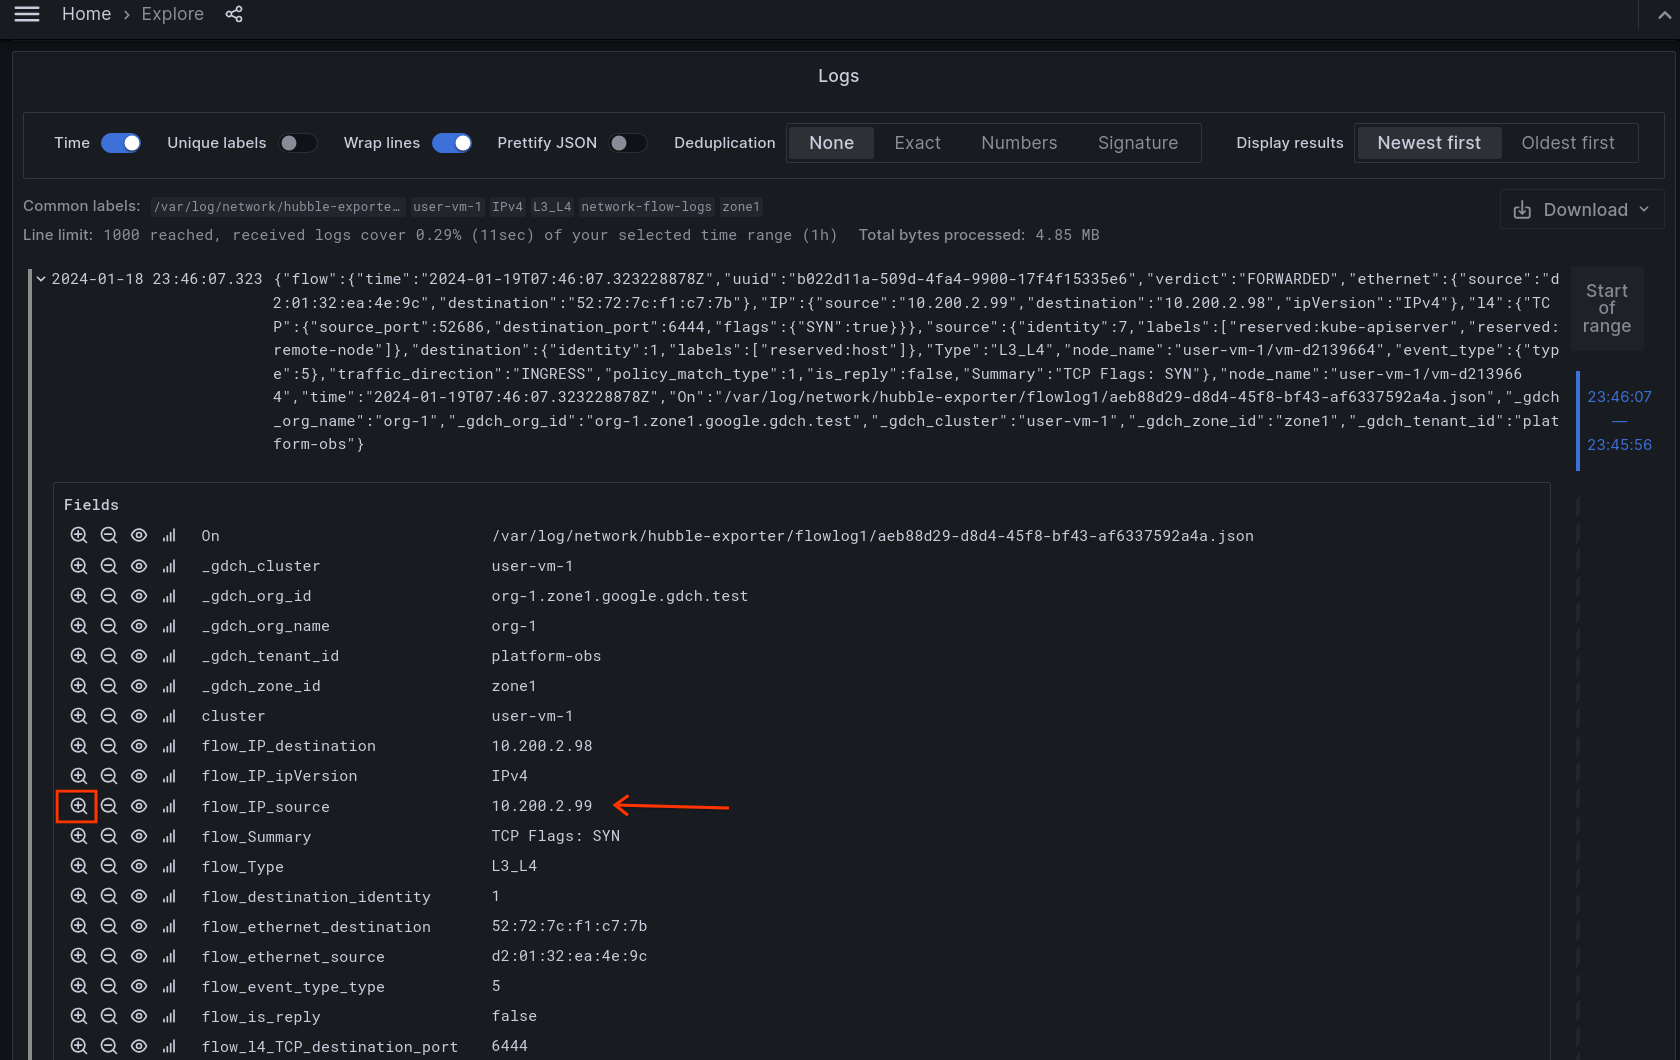
Click the
+shortcut icon to filter flows by a specific metadata field.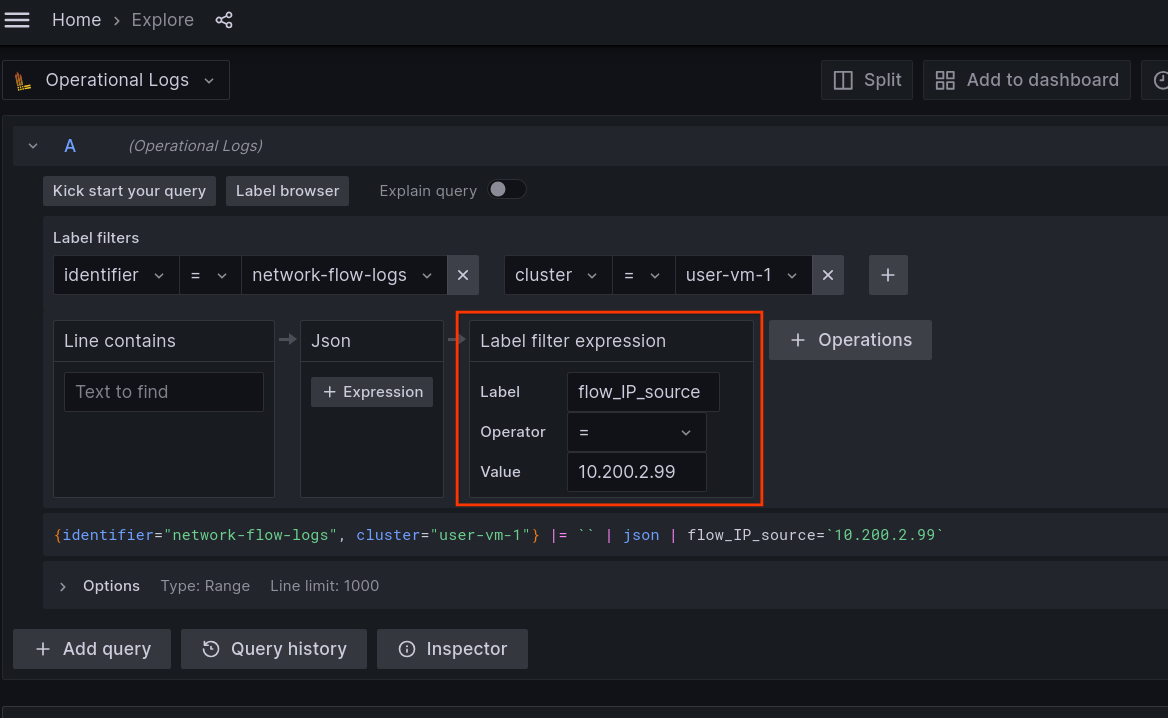
View results by flow log name
When multiple flow logs are created, an additional label filter can be created to view results from one or more flow logs.
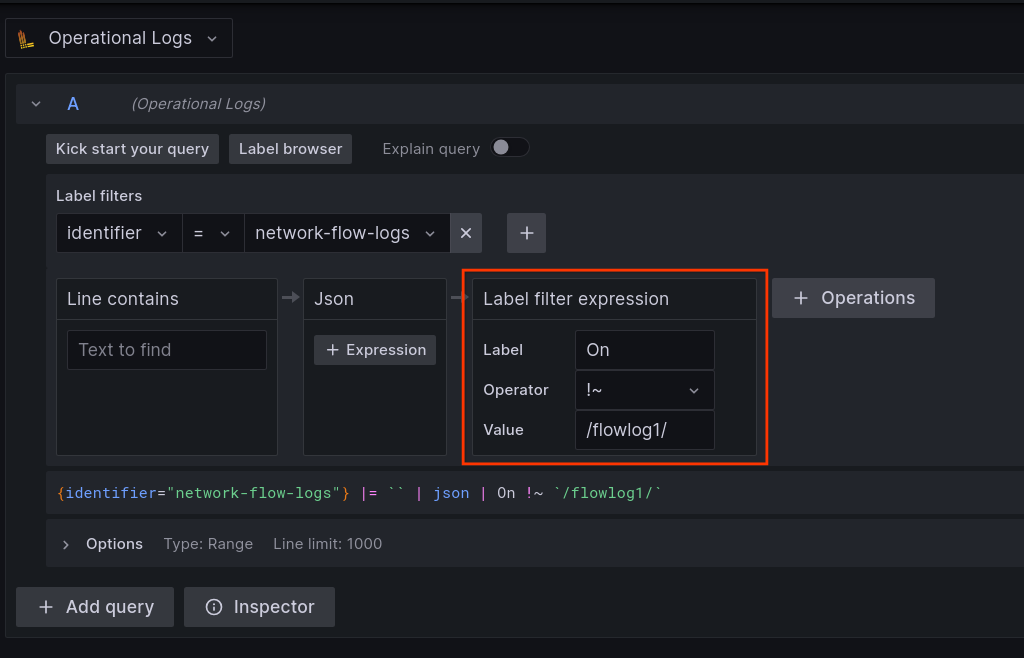
To view results limited to logs produced by FLOW_LOG_NAME, create a label filter with the following values:
Labelset toOn. This is case sensitive.Operatorset to~=. This uses a regular expression matcher.Valueset to/FLOW_LOG_NAME/. TheFLOW_LOG_NAMEvalue must be surrounded by/.
Filter results to only see logs produced by flowlog1:
References
- Documentation on Hubble Dynamic Exporter: https://docs.cilium.io/en/latest/observability/hubble-exporter/#dynamic-exporter-configuration