The metrics dashboard of the KUB component provides graphical information and visualization panels for viewing user cluster health.
Open the following URL to access the user cluster health dashboard:
https://GDC_URL/platform-obs/grafana/KUB-pa-cluster-metrics
Replace GDC_URL with the URL of your organization in Google Distributed Cloud (GDC) air-gapped.
KUB user cluster dashboard
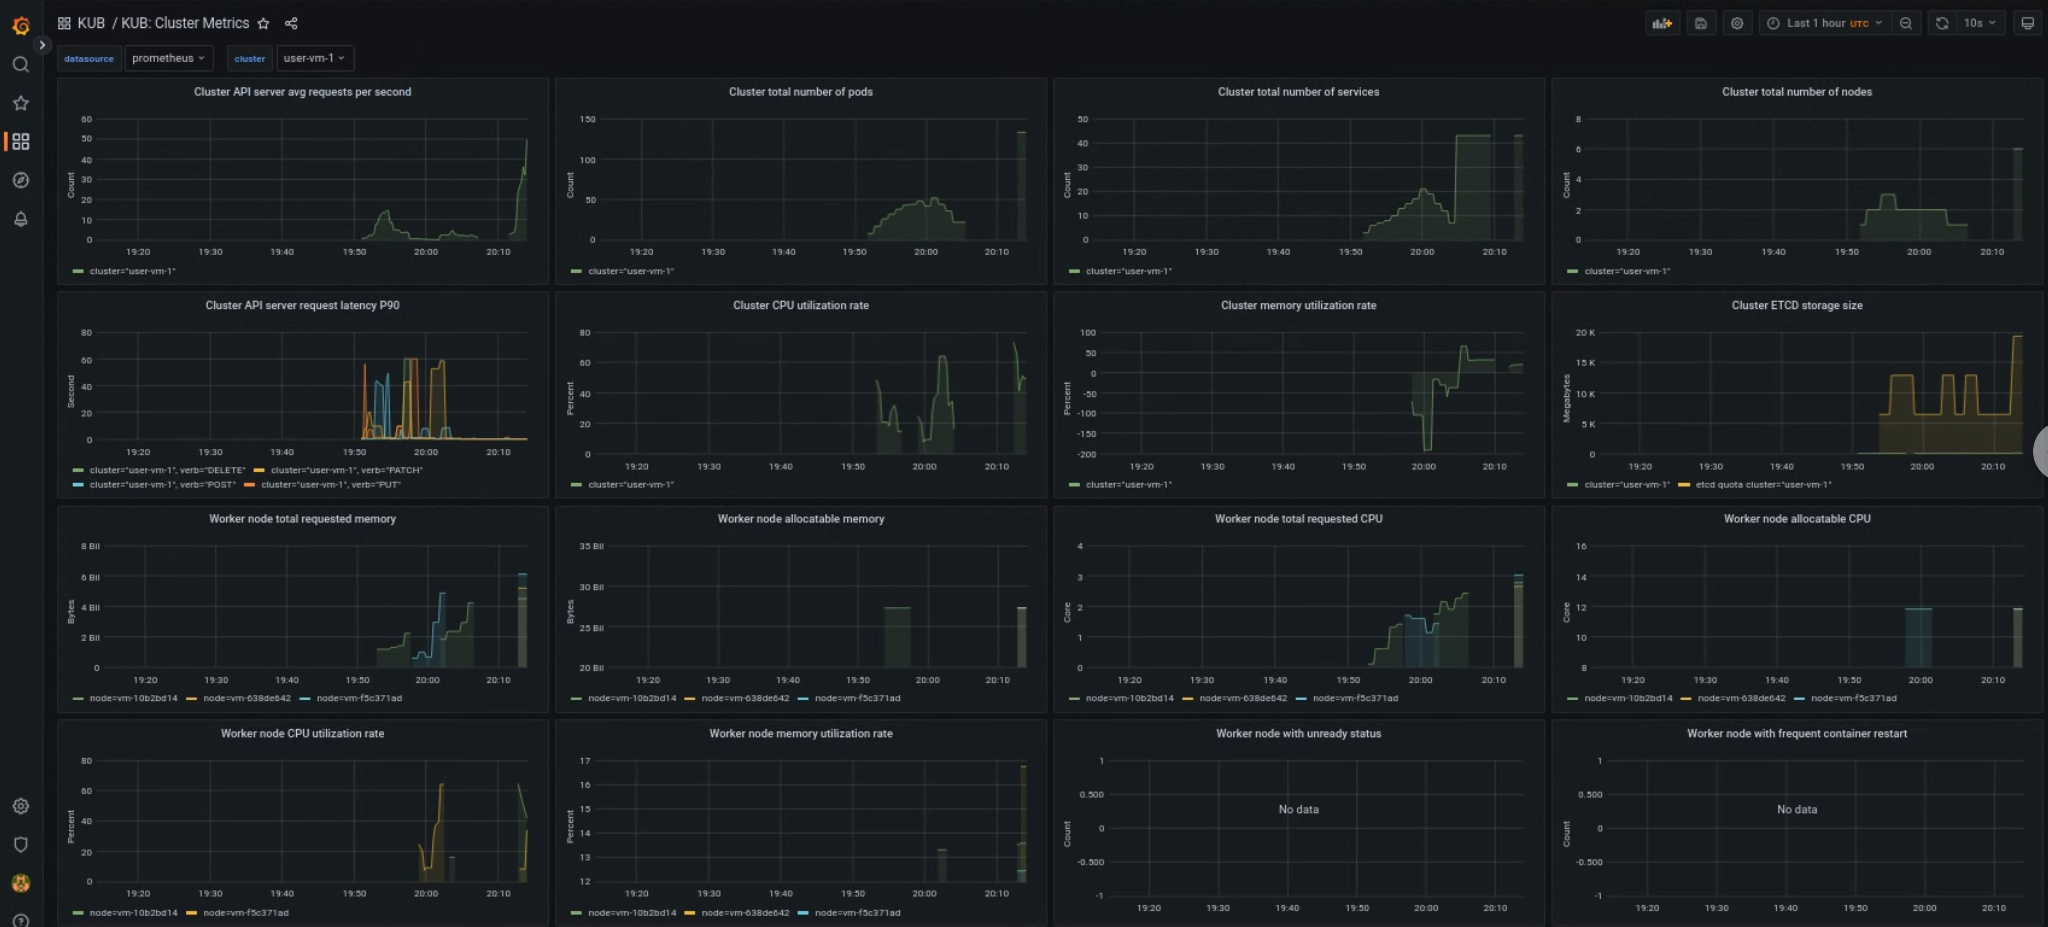
The KUB dashboard presents graphs and visualization panels that contain information about user cluster health in your project namespace.
You can view the general health of user clusters to troubleshoot issues and to identify potential resource constraints at the cluster level.
User cluster general health
In this dashboard, you can gain valuable insights for your Kubernetes cluster health, such as the following:
- API server traffic and latency
- Cluster CPU and memory usage
- Node conditions