您可以使用 Ops Agent(Google 推荐的 Compute Engine 遥测收集解决方案)跟踪虚拟机 (VM) 实例中的 GPU 利用率和 GPU 内存等指标。使用 Ops Agent,您可以按如下方式管理 GPU 虚拟机:
- 使用我们的预配置信息中心直观呈现 NVIDIA GPU 舰队的运行状况。
- 通过识别未充分利用的 GPU 并整合工作负载来优化费用。
- 通过查看趋势来决定何时扩展 GPU 容量或升级现有 GPU,从而对扩缩进行规划。
- 使用 NVIDIA Data Center GPU Manager (DCGM) 数据分析指标来确定制约 GPU 的因素及相关性能问题。
- 设置托管式实例组 (MIG) 以自动扩缩资源。
- 接收有关 NVIDIA GPU 指标的提醒。
本文档介绍了使用 Ops Agent 监控 Linux 虚拟机上的 GPU 的过程。此外,GitHub 上还提供了报告脚本,也可以用于监控 Linux 虚拟机上的 GPU 使用情况。如需了解详情,请参阅 compute-gpu-monitoring 监控脚本。此脚本没有积极维护。
如需监控 Windows 虚拟机上的 GPU,请参阅监控 GPU 性能 (Windows)。
概览
Ops Agent 2.38.0 版或更高版本可以自动跟踪安装了该代理的 Linux 虚拟机的 GPU 利用率和 GPU 内存用量。这些指标从 NVIDIA 管理库 (NVML) 获取,系统会针对任何使用 GPU 的进程,按每个 GPU 和每个进程对这些指标进行跟踪。如需查看 Ops Agent 监控的指标,请参阅“代理指标:gpu”。
您还可以通过 Ops Agent 设置 NVIDIA Data Center GPU Manager (DCGM) 集成。借助此集成,Ops Agent 可以使用 GPU 上的硬件计数器跟踪指标。DCGM 提供对 GPU 设备级指标的访问权限。这些指标包括流式多处理器 (SM) 块利用率、SM 占用率、SM 管道利用率、PCIe 流量速率和 NVLink 流量速率。如需查看 Ops Agent 监控的指标,请参阅“第三方应用指标:NVIDIA 数据中心 GPU 管理器 (DCGM)”。
如需使用 Ops Agent 查看 GPU 指标,请完成以下步骤:
- 在每个虚拟机上,检查您是否满足此处列出的要求。
- 在每个虚拟机上,安装 Ops Agent。
- 可选:在每个虚拟机上,设置 NVIDIA Data Center GPU Manager (DCGM) 集成。
- 在 Cloud Monitoring 中查看指标。
限制
- Ops Agent 不会跟踪使用 Container-Optimized OS 的虚拟机上的 GPU 利用率。
要求
检查每个虚拟机都满足以下要求:
- 每个虚拟机必须已挂接 GPU。
- 每个虚拟机必须已安装 GPU 驱动程序。
- 每个虚拟机的 Linux 操作系统及相应版本都必须支持 Ops Agent。查看支持 Ops Agent 的 Linux 操作系统的列表。
- 确保您拥有对每个虚拟机的
sudo访问权限。
安装 Ops Agent
如需安装 Ops Agent,请完成以下步骤:
如果您之前是使用
compute-gpu-monitoring监控脚本来跟踪 GPU 利用率,请在安装 Ops Agent 之前停用该服务。如需停用监控脚本,请运行以下命令:sudo systemctl --no-reload --now disable google_gpu_monitoring_agent
安装最新版本的 Ops Agent。如需了解详细说明,请参阅安装 Ops Agent。
安装 Ops Agent 后,如果您需要使用 Compute Engine 提供的安装脚本安装或升级 GPU 驱动程序,请查看“限制”部分。
查看 Compute Engine 中的 NVML 指标
您可以查看 Ops Agent 从 Compute Engine Linux 虚拟机实例的可观测性标签页中收集的 NVML 指标。
如需查看单个虚拟机的指标,请执行以下操作:
在 Google Cloud 控制台中,前往虚拟机实例页面。
选择虚拟机以打开详细信息页面。
点击可观测性标签页以显示有关虚拟机的信息。
选择 GPU 快速过滤条件。
如需查看多个虚拟机的指标,请执行以下操作:
在 Google Cloud 控制台中,前往虚拟机实例页面。
点击可观测性标签页。
选择 GPU 快速过滤条件。
可选:设置 NVIDIA 数据中心 GPU 管理器 (DCGM) 集成
Ops Agent 还提供 NVIDIA 数据中心 GPU 管理器 (DCGM) 集成,用于收集流式多处理器 (SM) 块利用率、SM 占用率、SM 管道利用率、PCIe 流量速率和 NVLink 流量速率等关键的高级 GPU 指标。
系统不会从 NVIDIA P100 和 P4 型号中收集这些高级 GPU 指标。
如需详细了解如何在每个虚拟机上设置和使用此集成,请参阅 NVIDIA 数据中心 GPU 管理器 (DCGM)。
在 Cloud Monitoring 中查看 DCGM 指标
在 Google Cloud 控制台中,前往 Monitoring 的“信息中心”页面。
选择示例库标签页。
在 过滤条件字段中,输入 NVIDIA。此时将显示 NVIDIA GPU 监控概览(GCE 和 GKE)信息中心。
如果您已设置 NVIDIA 数据中心 GPU 管理器 (DCGM) 集成,则还会显示 NVIDIA GPU 监控高级 DCGM 指标(仅限 GCE)信息中心。
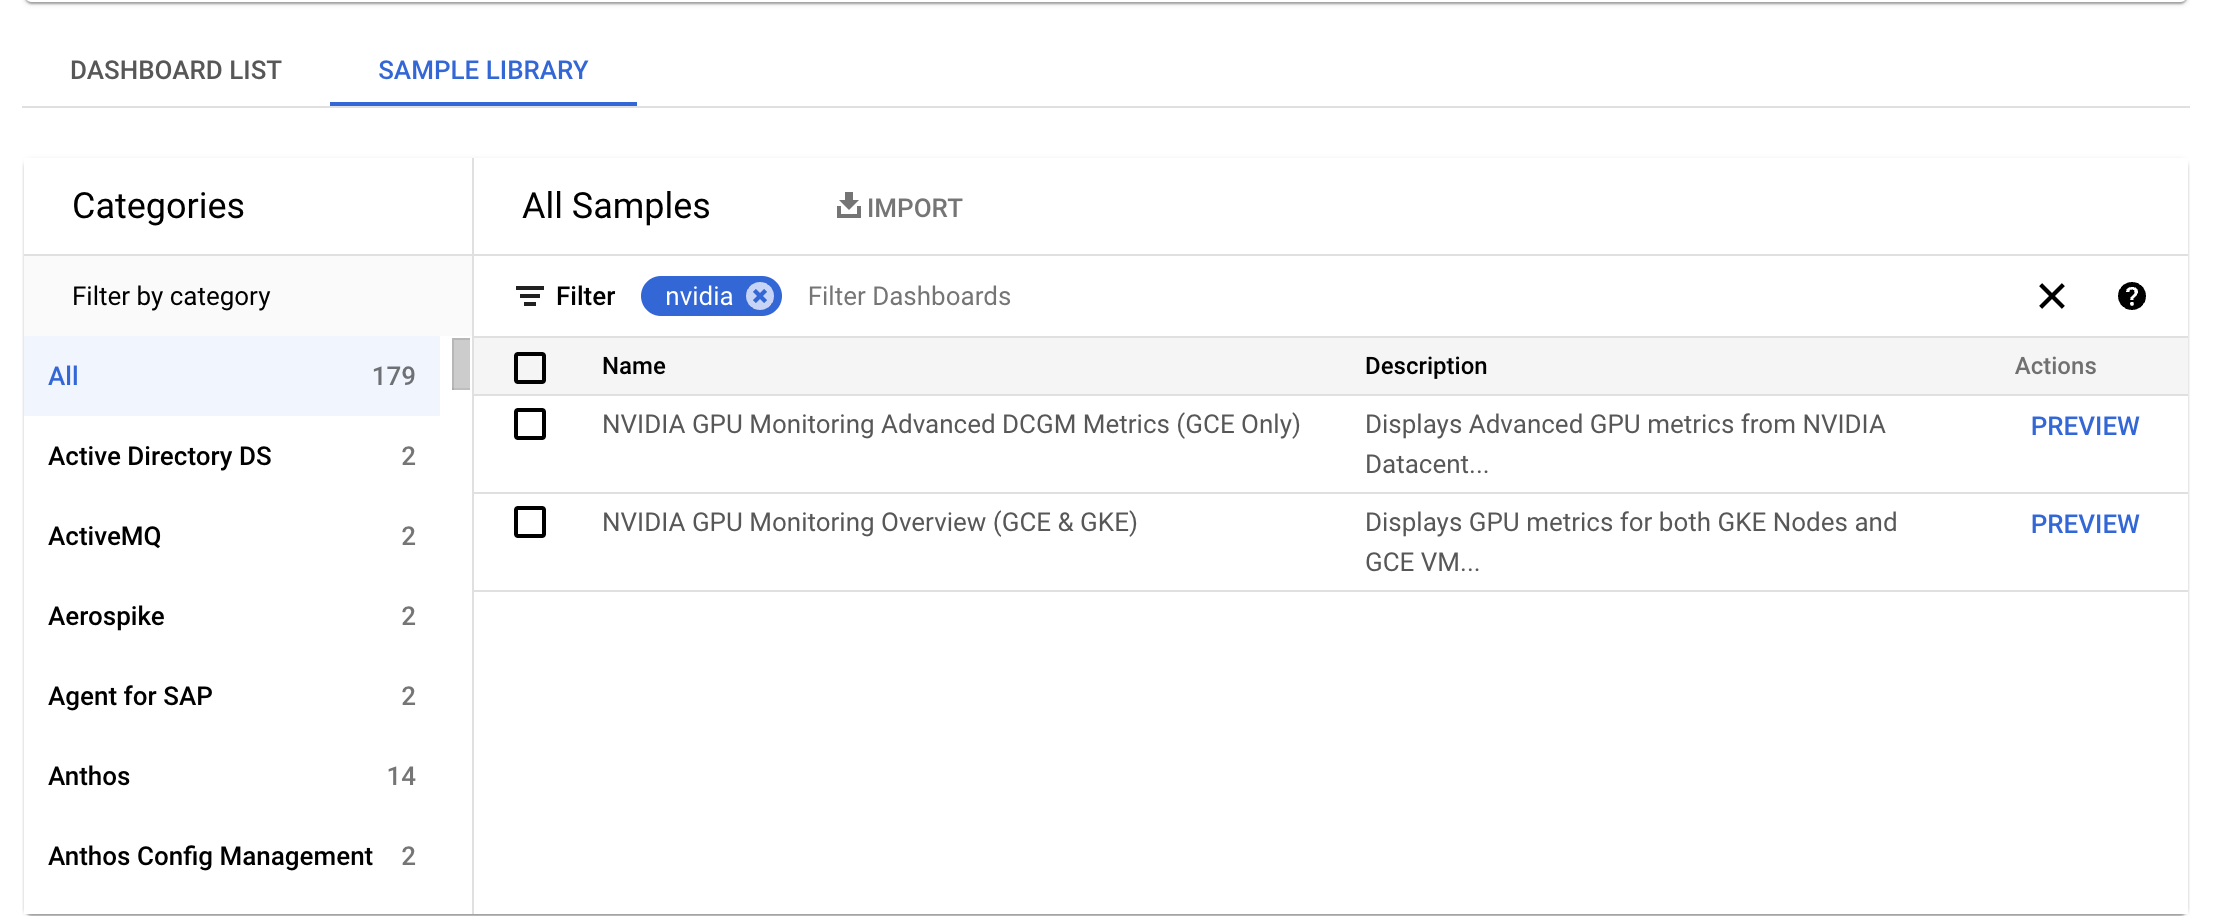
针对所需的信息中心,点击预览。此时会显示示例信息中心预览页面。
在示例信息中心预览页面中,点击导入示例信息中心。
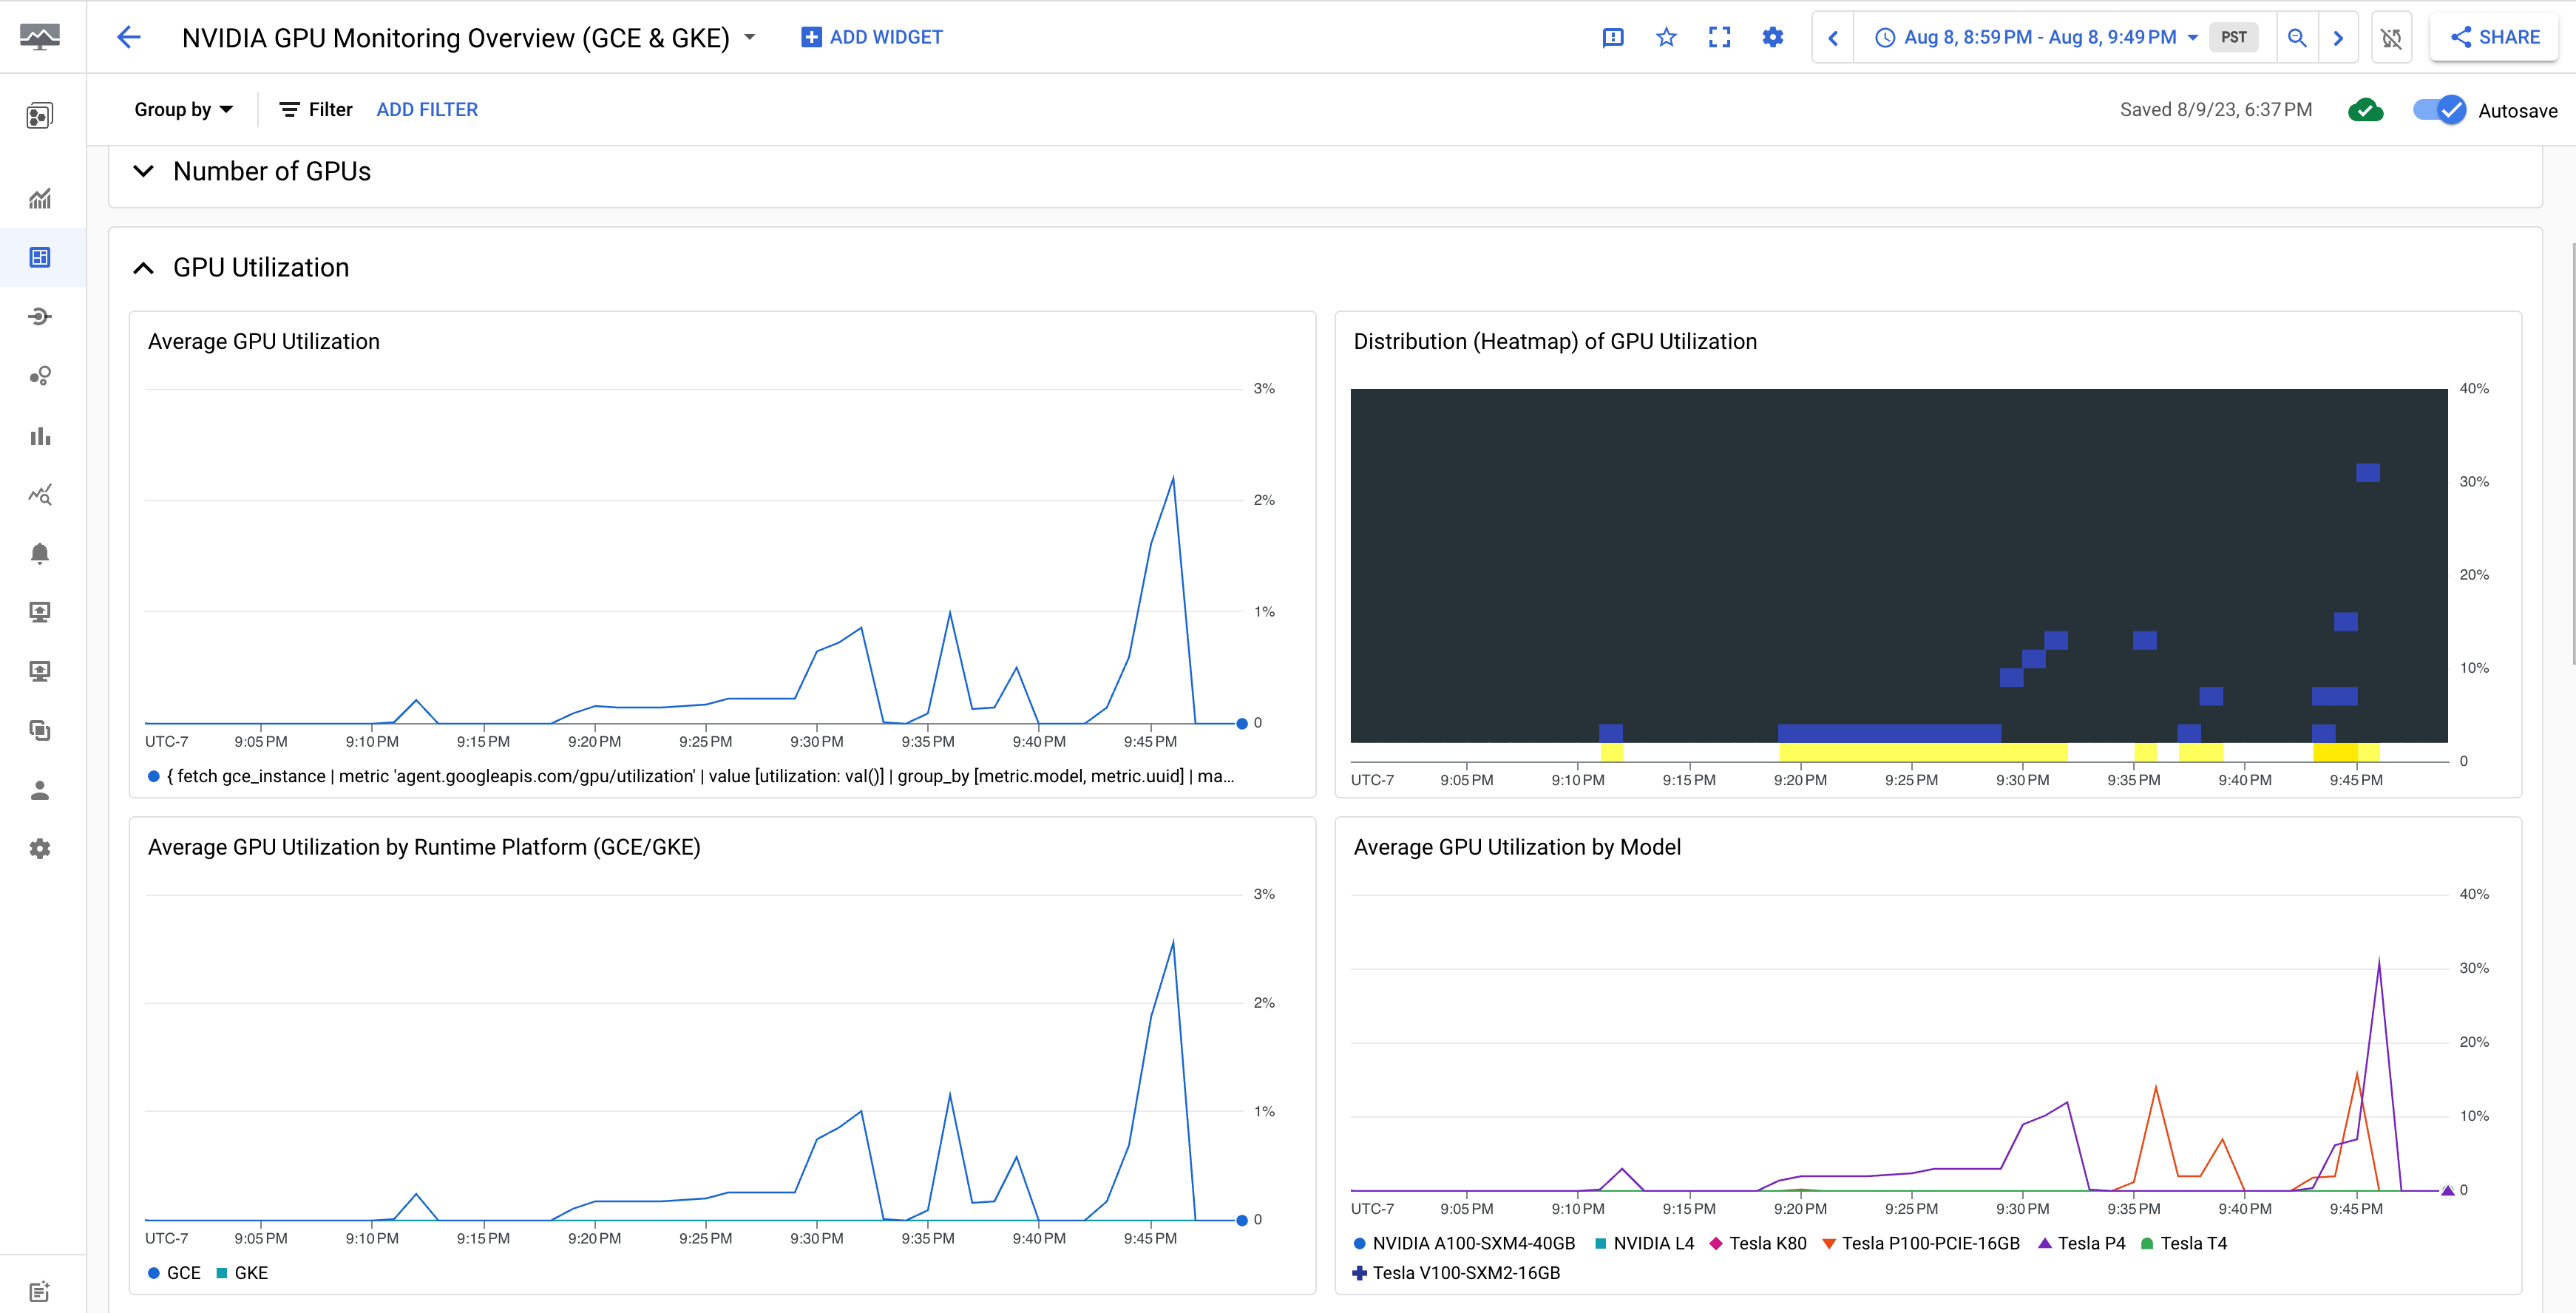
NVIDIA GPU 监控概览(GCE 和 GKE)信息中心显示了 GPU 指标,例如 GPU 利用率、NIC 流量速率和 GPU 内存用量。
您的 GPU 利用率显示内容类似于以下输出:
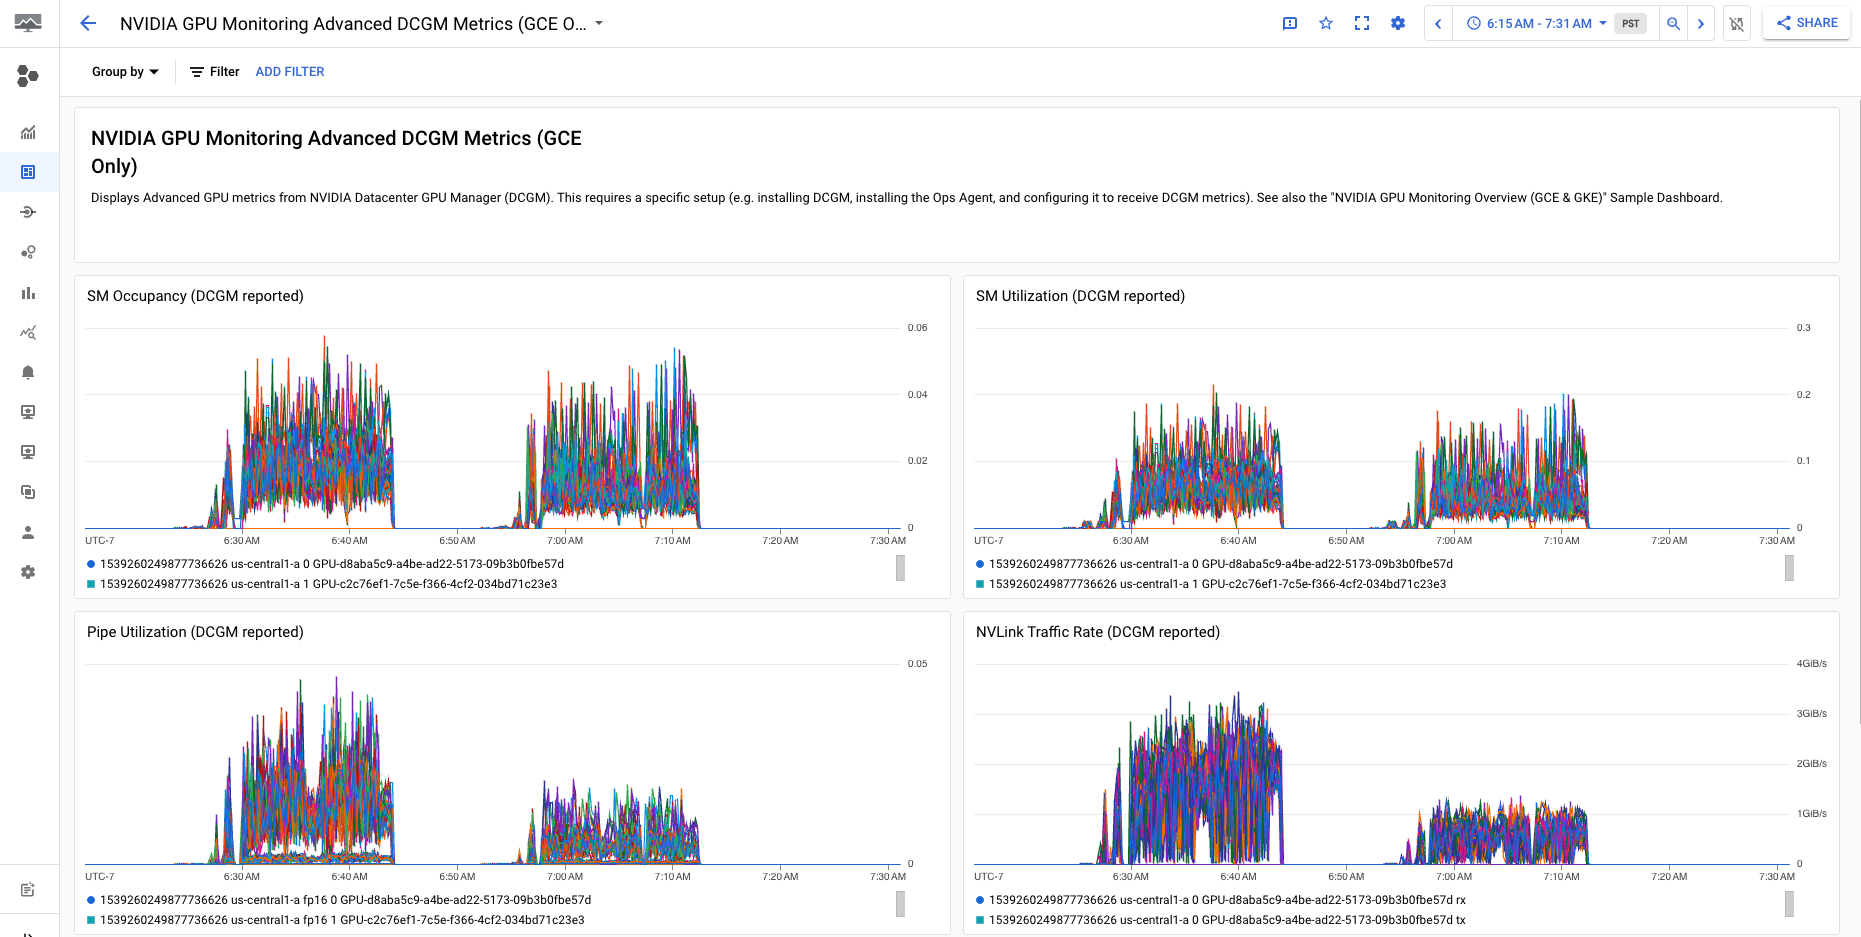
NVIDIA GPU 监控高级 DCGM 指标(仅限 GCE)信息中心显示关键高级指标,例如 SM 利用率、SM 占用率、SM 管道利用率、PCIe 流量速率和 NVLink 流量速率。
高级 DCGM 指标显示内容类似于以下输出:
后续步骤
- 如需处理 GPU 主机维护,请参阅处理 GPU 主机维护事件。
- 如需提升网络性能,请参阅使用更高的网络带宽。