Como monitorar o desempenho da GPU em VMs do Linux
Mantenha tudo organizado com as coleções
Salve e categorize o conteúdo com base nas suas preferências.
Linux
Rastreie métricas como utilização de GPU e memória da GPU de suas instâncias de máquina virtual (VM) usando o Agente de operações, que é a solução de coleta de telemetria recomendada pelo Google para o Compute Engine.
Ao usar o Agente de operações, é possível gerenciar as VMs da GPU da seguinte maneira:
Visualize a integridade da sua frota de GPUs NVIDIA com nossos painéis
pré-configurados.
Otimize os custos identificando GPUs subutilizadas e consolidando cargas de trabalho.
Planeje o escalonamento analisando as tendências para decidir quando expandir a capacidade da GPU ou fazer upgrade das GPUs atuais.
Use as métricas de criação de perfil do NVIDIA Data Center GPU Manager (DCGM) para identificar gargalos e problemas de desempenho nas GPUs.
Receba alertas sobre métricas das suas GPUs NVIDIA.
Neste documento, abordamos os procedimentos para monitorar GPUs em VMs do Linux usando
o Agente de operações. Como alternativa, há um script de relatório disponível no GitHub que também pode
ser configurado para monitorar o uso da GPU em VMs do Linux. Consulte
Script de monitoramento compute-gpu-monitoring.
Este script não é mantido ativamente.
O Agente de operações, versão 2.38.0 ou posterior, pode rastrear automaticamente a utilização
da GPU e as taxas de uso da memória GPU nas VMs do Linux que têm o agente
instalado. Essas métricas, coletadas na
Biblioteca de Gerenciamento NVIDIA (NVML), são rastreadas por GPU
e por processo para qualquer processo que use GPUs.
Para conferir as métricas monitoradas pelo agente de operações,
consulte Métricas do agente: gpu.
Também é possível configurar a integração do NVIDIA Data Center GPU Manager (DCGM) com
o Agente de operações. Essa integração permite que o agente de operações rastreie métricas
usando os contadores de hardware na GPU. O DCGM fornece acesso às
métricas no nível do dispositivo da GPU. Isso inclui
a utilização de blocos de Multiprocessador de streaming (SM), a ocupação do SM,
a utilização do pipeline do SM, a taxa de tráfego PCIe e a taxa de tráfego do NVLink. Para conferir as métricas monitoradas pelo agente de operações, consulte Métricas de aplicativos de terceiros: gerenciador de GPU do NVIDIA Data Center (DCGM).
Para analisar as métricas da GPU usando o agente de operações, siga estas etapas:
O sistema operacional e a versão do Linux para cada uma das VMs precisam ser compatíveis com o
agente de operações. Confira a lista de
sistemas operacionais Linux compatíveis com o agente de operações.
Verifique se você tem acesso a sudo para cada VM.
Instalar o Agente de operações
Para instalar o agente, siga estes passos:
Se você estava usando o
script de monitoramento compute-gpu-monitoring
para monitorar a utilização da GPU, desative o serviço antes de instalar o agente de operações.
Para desativar o script de monitoramento, execute o seguinte comando:
Opcional: configurar a integração do NVIDIA Data Center GPU Manager (DCGM)
O Agente de operações também oferece integração com o NVIDIA Data Center GPU Manager
(DCGM) para coletar métricas de GPU avançadas importantes, como utilização de blocos de Multiprocessador de Streaming (SM), ocupação de SM, utilização de pipeline SM, taxa de tráfego PCIe e taxa de tráfego de NVLink.
Essas métricas avançadas de GPU não são coletadas para os modelos NVIDIA P100 e P4.
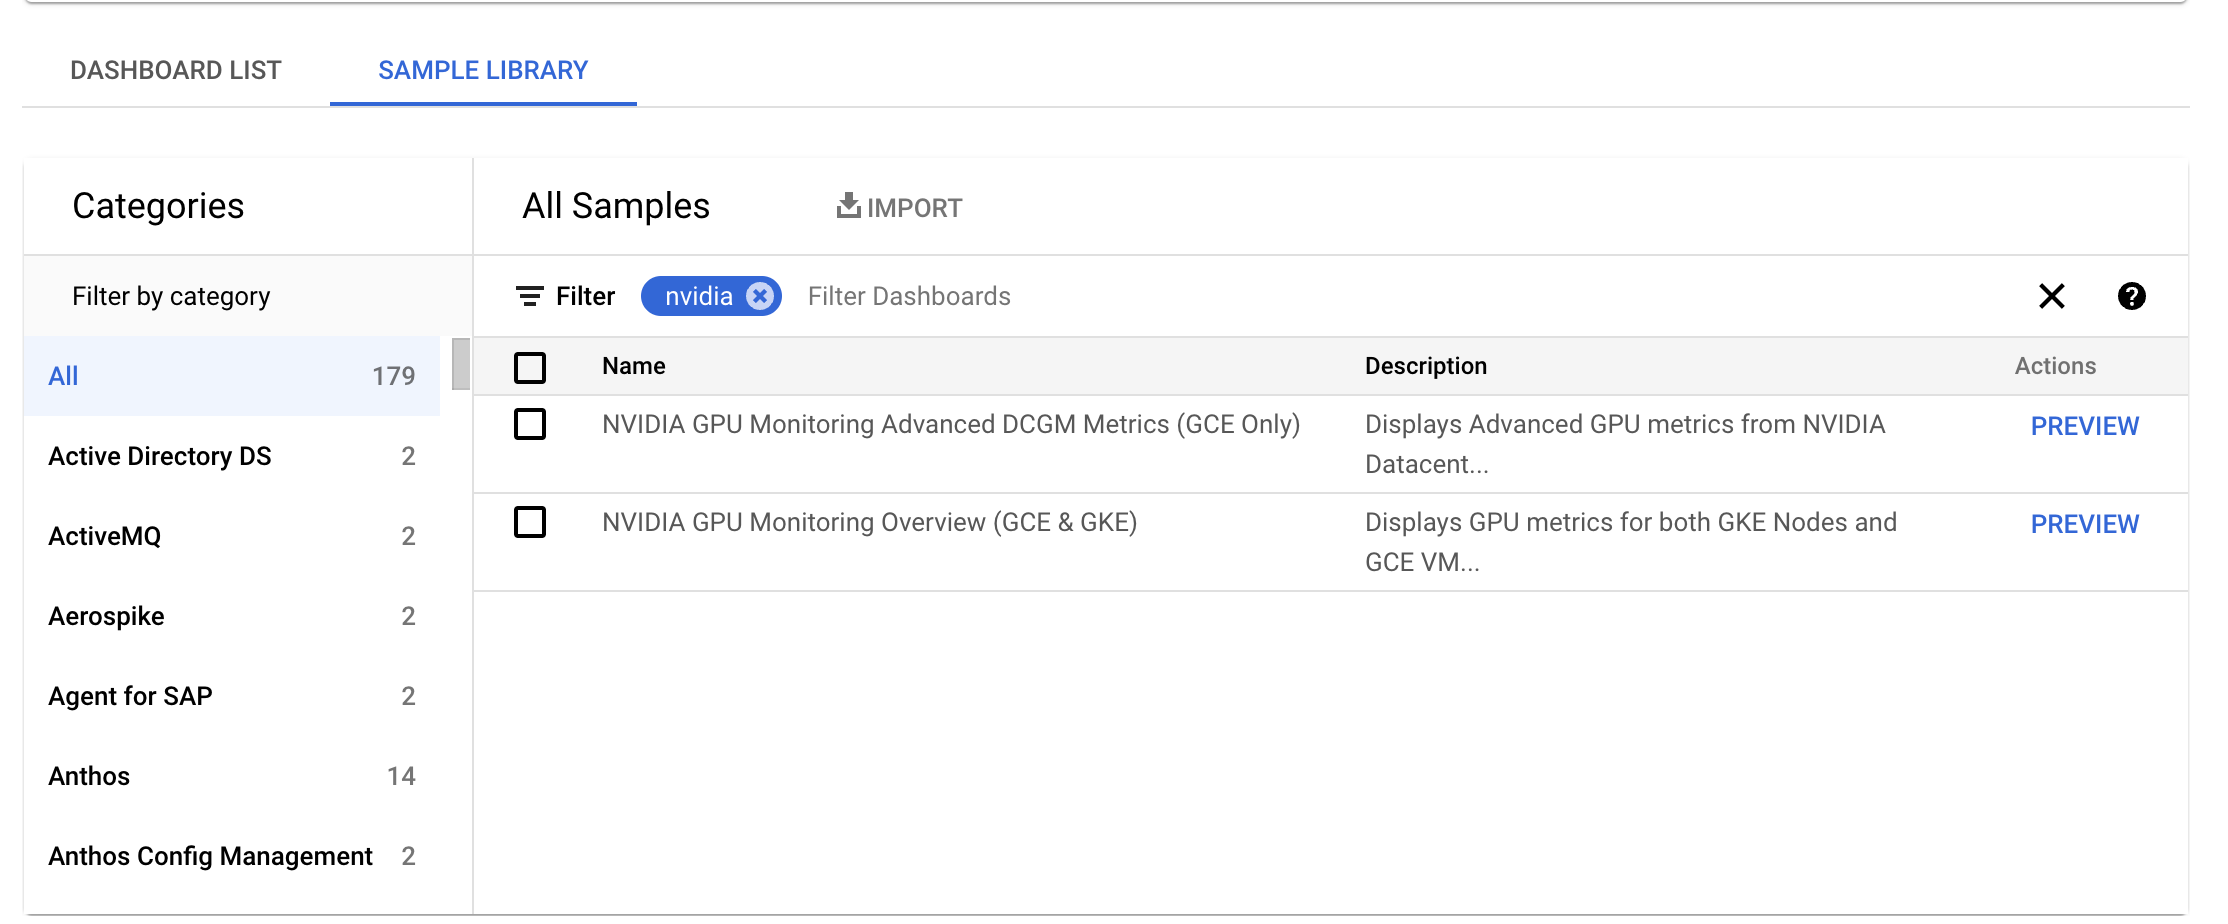
No campo Filtrofilter_list,
digite NVIDIA. O painel
Visão geral do monitoramento de GPU NVIDIA (GCE e GKE)
é exibido.
Se você configurou a integração do NVIDIA Data Center GPU Manager (DCGM), o painel
Métricas avançadas de DCGM do monitoramento de GPU NVIDIA (somente GCE)
também será exibido.
No painel necessário, clique em Visualizar. A página Visualização do painel de amostra
é exibida.
Na página Visualização do painel de amostra, clique em Importar painel de amostra.
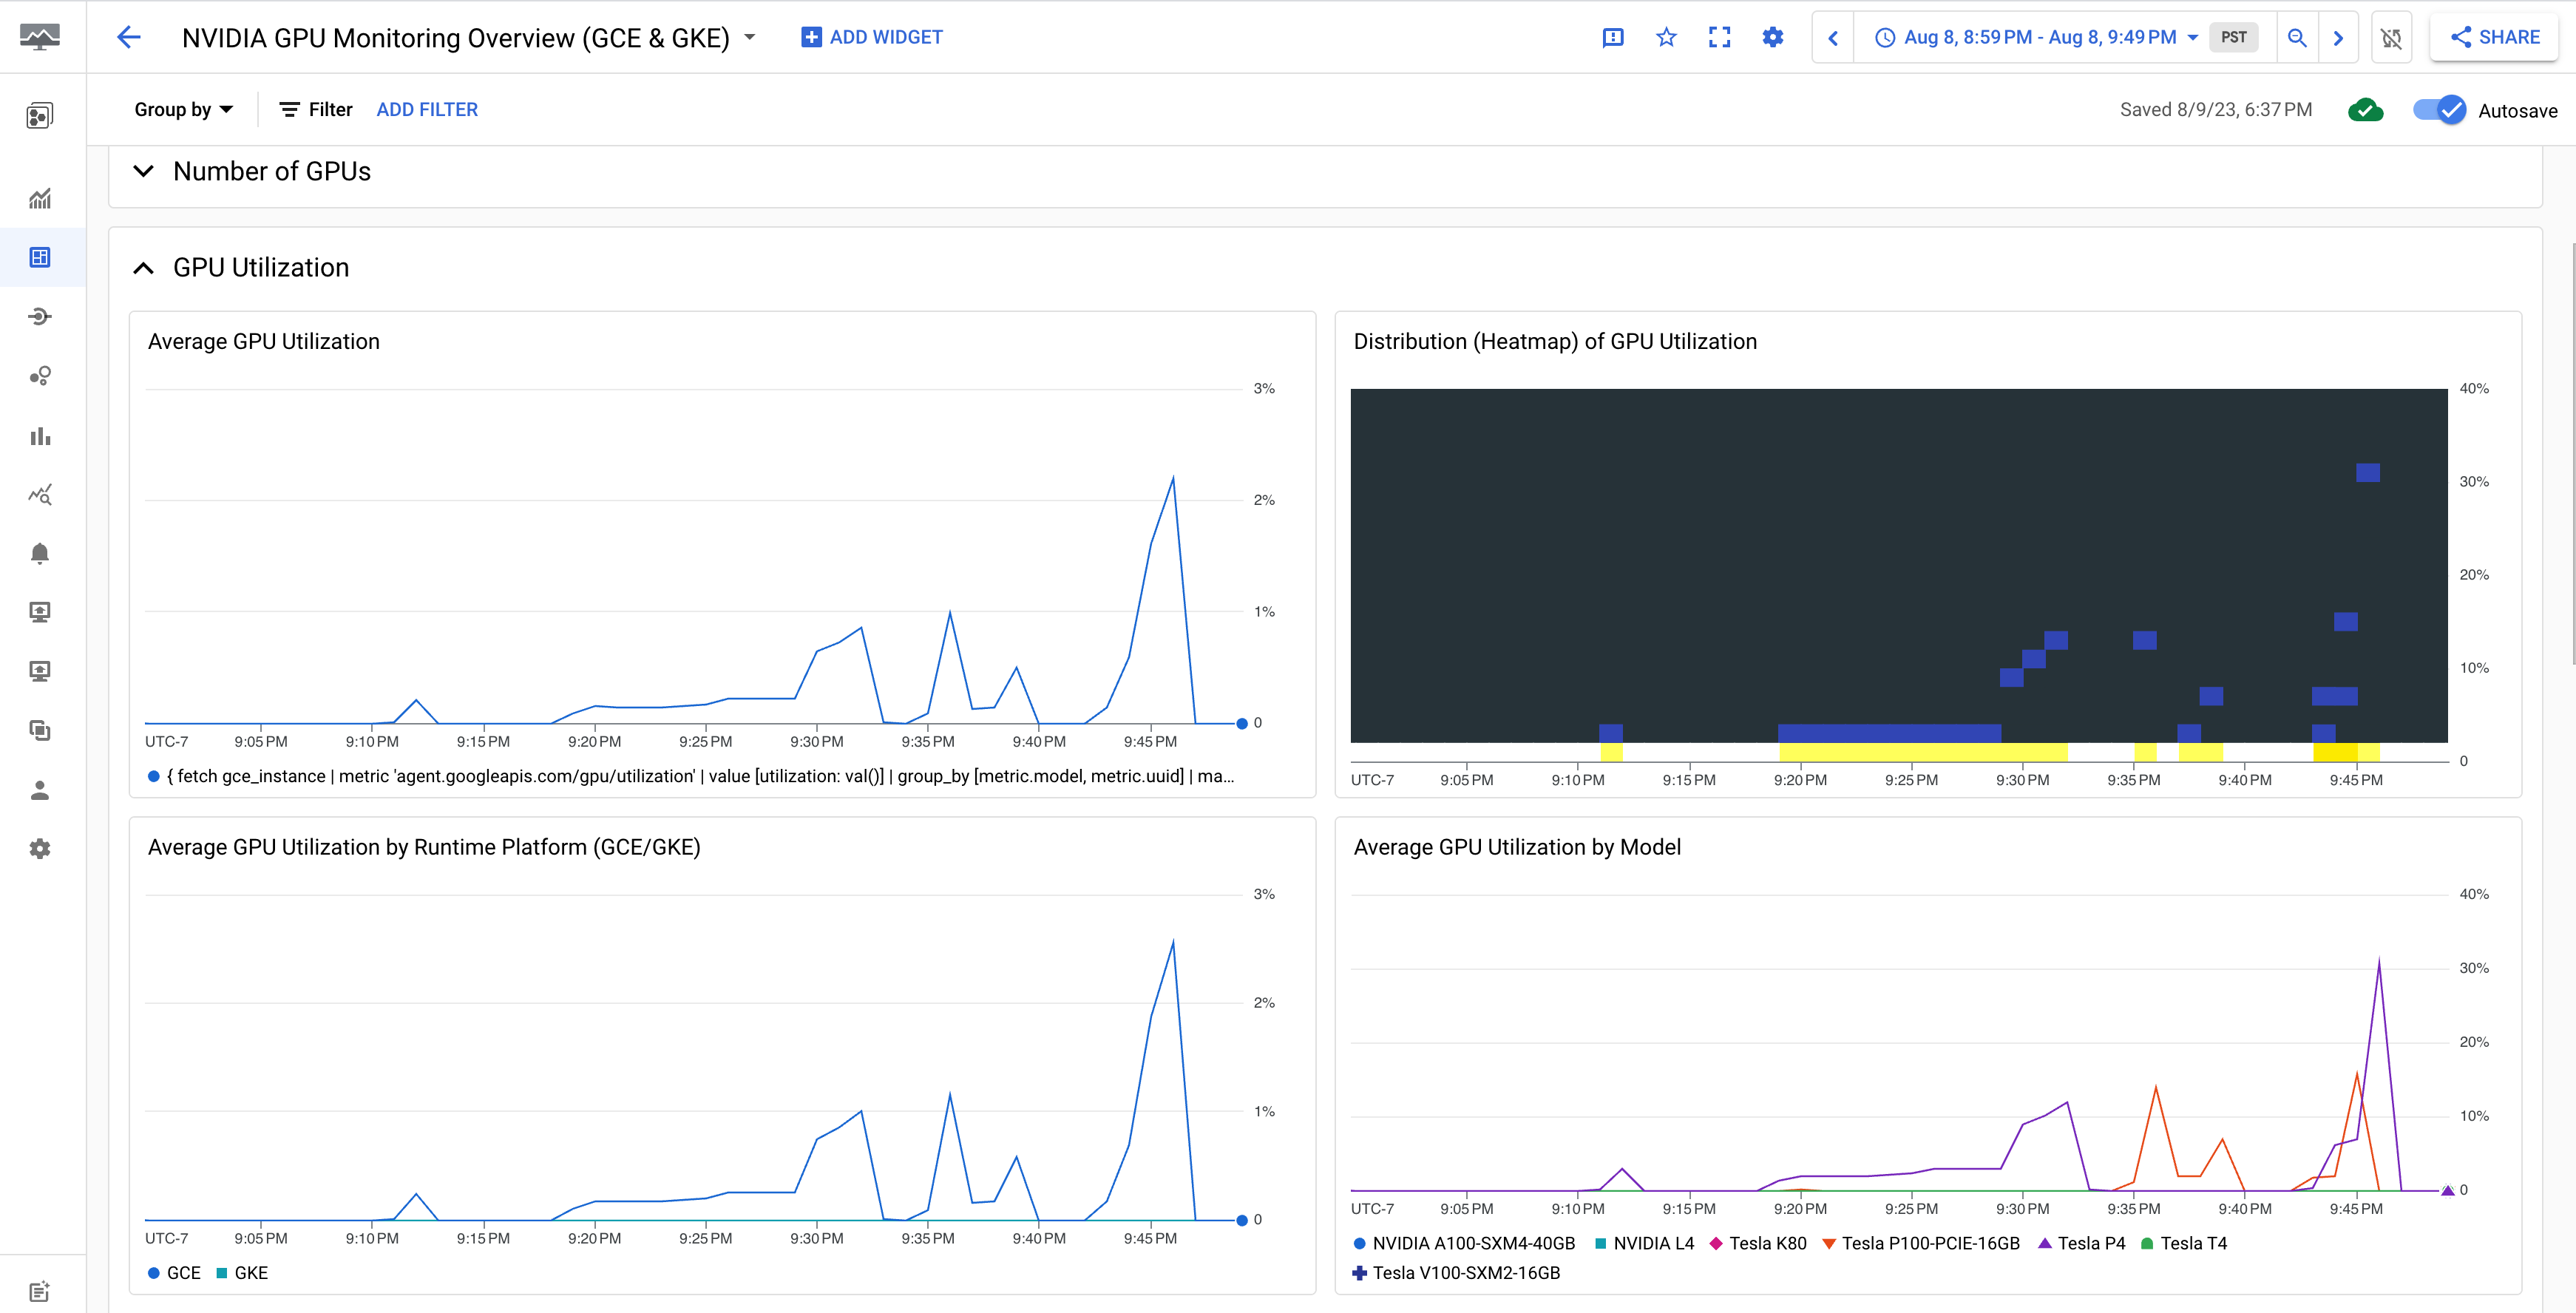
O painel Visão geral do monitoramento de GPU NVIDIA (GCE e GKE)
exibe as métricas da GPU, como o uso da GPU, a taxa de tráfego da NIC
e o uso da memória da GPU.
A exibição de utilização da GPU é semelhante a esta:
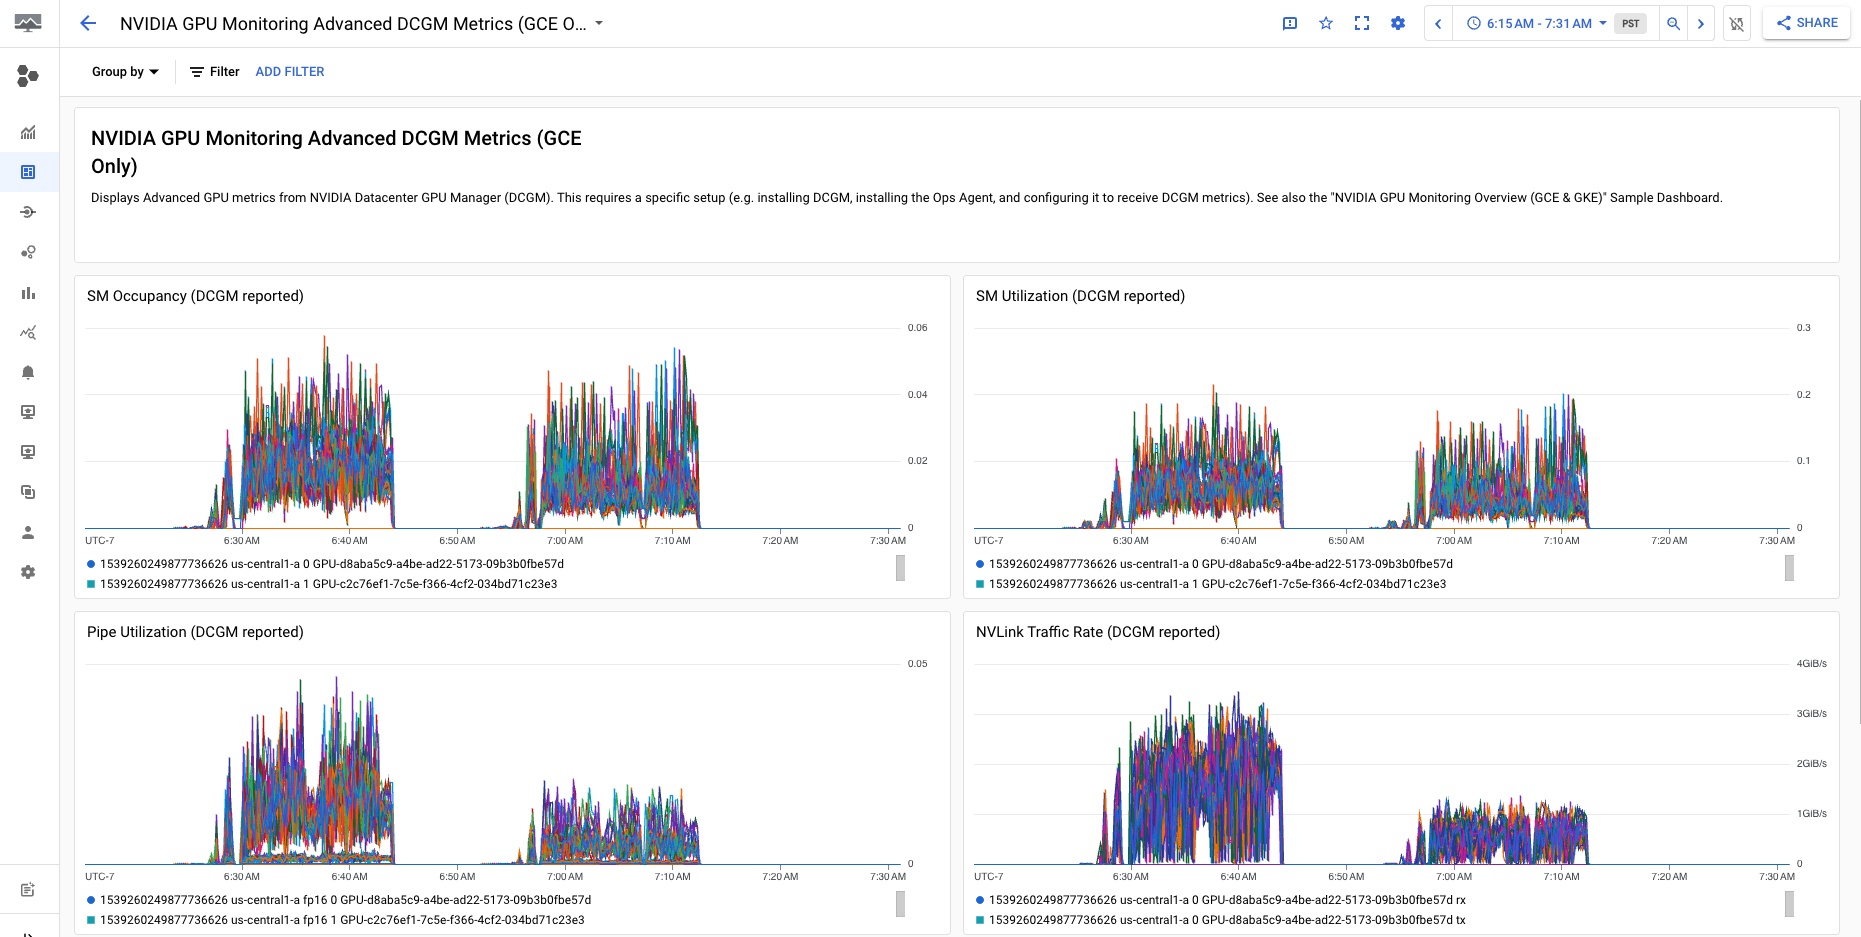
O
Métricas avançadas de DCGM do monitoramento de GPU NVIDIA (somente GCE) O painel exibe as principais métricas avançadas, como a utilização de SM, a ocupação de SM, a utilização do pipeline do SM, a taxa de tráfego do PCIe e a taxa de tráfego do NVLink.
A exibição da métrica avançada do DCGM é semelhante à seguinte saída:
[[["Fácil de entender","easyToUnderstand","thumb-up"],["Meu problema foi resolvido","solvedMyProblem","thumb-up"],["Outro","otherUp","thumb-up"]],[["Difícil de entender","hardToUnderstand","thumb-down"],["Informações incorretas ou exemplo de código","incorrectInformationOrSampleCode","thumb-down"],["Não contém as informações/amostras de que eu preciso","missingTheInformationSamplesINeed","thumb-down"],["Problema na tradução","translationIssue","thumb-down"],["Outro","otherDown","thumb-down"]],["Última atualização 2025-08-18 UTC."],[[["\u003cp\u003eThe Ops Agent, version 2.38.0 or later, is Google's recommended solution for tracking GPU utilization and memory on Linux virtual machines (VMs) and can manage your GPU VMs.\u003c/p\u003e\n"],["\u003cp\u003eUsing the Ops Agent, you can visualize GPU fleet health, optimize costs, plan scaling, identify bottlenecks with NVIDIA Data Center GPU Manager (DCGM) profiling metrics, and set alerts.\u003c/p\u003e\n"],["\u003cp\u003eThe Ops Agent collects metrics from the NVIDIA Management Library (NVML) and, with optional DCGM integration, can track advanced GPU metrics such as Streaming Multiprocessor utilization and PCIe traffic rate.\u003c/p\u003e\n"],["\u003cp\u003eTo use the Ops Agent, users must ensure their VMs have attached GPUs, installed GPU drivers, and support the Ops Agent with their Linux operating system, in addition to installing the agent.\u003c/p\u003e\n"],["\u003cp\u003eYou can review NVML metrics within the Compute Engine's Observability tab and review DCGM metrics in the Monitoring section, with provided dashboards.\u003c/p\u003e\n"]]],[],null,["# Monitoring GPU performance on Linux VMs\n\nLinux\n\n*** ** * ** ***\n\n| **Tip:** If you want to monitor A4 or A3 Ultra machine types that are deployed using the features provided by Cluster Director, see [Monitor VMs and clusters](/ai-hypercomputer/docs/monitor) in the AI Hypercomputer documentation instead.\n\nYou can track metrics such as GPU utilization and GPU memory from your\nvirtual machine (VM) instances by using the\n[Ops Agent](/stackdriver/docs/solutions/agents/ops-agent), which is\nGoogle's recommended telemetry collection solution for Compute Engine.\nBy using the Ops Agent, you can manage your GPU VMs as follows:\n\n- Visualize the health of your NVIDIA GPU fleet with our pre-configured dashboards.\n- Optimize costs by identifying underutilized GPUs and consolidating workloads.\n- Plan scaling by looking at trends to decide when to expand GPU capacity or upgrade existing GPUs.\n- Use NVIDIA Data Center GPU Manager (DCGM) profiling metrics to identify bottlenecks and performance issues within your GPUs.\n- Set up [managed instance groups (MIGs)](/compute/docs/instance-groups#managed_instance_groups) to autoscale resources.\n- Get alerts on metrics from your NVIDIA GPUs.\n\nThis document covers the procedures for monitoring GPUs on Linux VMs by using\nthe Ops Agent. Alternatively, a reporting script is available on GitHub that can\nalso be setup for monitoring GPU usage on Linux VMs, see\n[`compute-gpu-monitoring` monitoring script](https://github.com/GoogleCloudPlatform/compute-gpu-monitoring/tree/main/linux).\nThis script is not actively maintained.\n\nFor monitoring GPUs on Windows VMs, see\n[Monitoring GPU performance (Windows)](/compute/docs/gpus/monitor-gpus-windows).\n\nOverview\n--------\n\nThe Ops Agent, version 2.38.0 or later, can automatically track GPU\nutilization and GPU memory usage rates on your Linux VMs that have the agent\ninstalled. These metrics, obtained from the NVIDIA Management Library (NVML),\nare tracked per GPU and per process for any process that uses GPUs.\nTo view the metrics that are monitored by the Ops Agent,\nsee [Agent metrics: gpu](/monitoring/api/metrics_opsagent#agent-gpu).\n\nYou can also set up the NVIDIA Data Center GPU Manager (DCGM) integration with\nthe Ops Agent. This integration allows the Ops Agent to track metrics\nusing the hardware counters on the GPU. DCGM provides access to the\nGPU device-level metrics. These include Streaming Multiprocessor (SM)\nblock utilization, SM occupancy, SM pipe utilization, PCIe traffic rate,\nand NVLink traffic rate. To view the metrics monitored by the Ops Agent, see\n[Third-party application metrics: NVIDIA Data Center GPU Manager (DCGM)](/monitoring/api/metrics_opsagent#opsagent-dcgm).\n\nTo review GPU metrics by using the Ops Agent, complete the following steps:\n\n1. On each VM, check that you have met [the requirements](#requirements).\n2. On each VM, [install the Ops Agent](#install-ops-agent).\n3. Optional: On each VM, set up the [NVIDIA Data Center GPU Manager (DCGM) integration](#dcgm).\n4. Review [metrics in Cloud Monitoring](#review-metrics-dashboard).\n\nLimitations\n-----------\n\n- The Ops Agent doesn't track GPU utilization on VMs that use Container-Optimized OS.\n\nRequirements\n------------\n\nOn each of your VMs, check that you meet the following requirements:\n\n- Each VM must have [GPUs attached](/compute/docs/gpus/create-vm-with-gpus).\n- Each VM must have a [GPU driver installed](/compute/docs/gpus/install-drivers-gpu#verify-driver-install).\n- The Linux operating system and version for each of your VM must support the Ops Agent. See the list of [Linux operating systems](/stackdriver/docs/solutions/agents/ops-agent#linux_operating_systems) that support the Ops Agent.\n- Ensure you have `sudo` access to each VM.\n\nInstall the Ops Agent\n---------------------\n\nTo install the Ops Agent, complete the following steps:\n\n1. If you were previously using the\n [`compute-gpu-monitoring` monitoring script](https://github.com/GoogleCloudPlatform/compute-gpu-monitoring/tree/main/linux)\n to track GPU utilization, disable the service before installing the Ops Agent.\n To disable the monitoring script, run the following command:\n\n ```\n sudo systemctl --no-reload --now disable google_gpu_monitoring_agent\n ```\n2. Install the latest version of the Ops Agent. For detailed instructions, see\n [Installing the Ops Agent](/stackdriver/docs/solutions/agents/ops-agent/install-index).\n\n3. After you have installed the Ops agent, if you need to install or upgrade your\n GPU drivers by using the\n [installation scripts provided by Compute Engine](/compute/docs/gpus/install-drivers-gpu#installation_scripts),\n review the *limitations* section.\n\nReview NVML metrics in Compute Engine\n-------------------------------------\n\nYou can review the NVML metrics that the Ops Agent collects from the\n**Observability** tabs for Compute Engine Linux VM instances.\n\nTo view the metrics for a single VM do the following:\n\n1. In the Google Cloud console, go to the **VM instances** page.\n\n [Go to VM instances](https://console.cloud.google.com/compute/instances)\n2. Select a VM to open the **Details** page.\n\n3. Click the **Observability** tab to display information about the VM.\n\n4. Select the **GPU** quick filter.\n\nTo view the metrics for multiple VMs, do the following:\n\n1. In the Google Cloud console, go to the **VM instances** page.\n\n [Go to VM instances](https://console.cloud.google.com/compute/instances)\n2. Click the **Observability** tab.\n\n3. Select the **GPU** quick filter.\n\nOptional: Set up NVIDIA Data Center GPU Manager (DCGM) integration\n------------------------------------------------------------------\n\nThe Ops Agent also provides integration for NVIDIA Data Center GPU Manager\n(DCGM) to collect key advanced GPU metrics such as Streaming Multiprocessor (SM)\nblock utilization, SM occupancy, SM pipe utilization, PCIe traffic rate,\nand NVLink traffic rate.\n\nThese advanced GPU metrics are not collected from NVIDIA P100 and P4 models.\n\nFor detailed instructions on how to setup and use this integration on each VM,\nsee [NVIDIA Data Center GPU Manager (DCGM)](/stackdriver/docs/solutions/agents/ops-agent/third-party-nvidia).\n\nReview DCGM metrics in Cloud Monitoring\n---------------------------------------\n\n1. In the Google Cloud console, go to the **Monitoring \\\u003e Dashboards** page.\n\n [Go to Monitoring](https://console.cloud.google.com/monitoring/dashboards)\n2. Select the **Sample Library** tab.\n\n3. In the filter_list **Filter** field,\n type **NVIDIA** . The\n **NVIDIA GPU Monitoring Overview (GCE and GKE)**\n dashboard displays.\n\n If you have set up the NVIDIA Data Center GPU Manager (DCGM) integration, the\n **NVIDIA GPU Monitoring Advanced DCGM Metrics (GCE Only)**\n dashboard also displays.\n\n4. For the required dashboard, click **Preview** . The **Sample dashboard preview**\n page displays.\n\n5. From the **Sample dashboard preview** page, click **Import sample dashboard**.\n\n - The **NVIDIA GPU Monitoring Overview (GCE and GKE)**\n dashboard displays the GPU metrics such as GPU utilization, NIC traffic rate,\n and GPU memory usage.\n\n Your GPU utilization display is similar to the following output:\n\n - The\n **NVIDIA GPU Monitoring Advanced DCGM Metrics (GCE Only)**\n dashboard displays key advanced metrics such as SM utilization, SM occupancy,\n SM pipe utilization, PCIe traffic rate, and NVLink traffic rate.\n\n Your Advanced DCGM Metric display is similar to the following output:\n\nWhat's next?\n------------\n\n- To handle GPU host maintenance, see [Handling GPU host maintenance events](/compute/docs/gpus/gpu-host-maintenance).\n- To improve network performance, see [Use higher network bandwidth](/compute/docs/gpus/optimize-gpus)."]]