為了協助提高資源使用率,您可以追蹤虛擬機器 (VM) 執行個體的 GPU 使用率。
瞭解 GPU 使用率後,您就可以執行各種工作,例如設定代管執行個體群組,以自動調度資源。
如要使用 Cloud Monitoring 查看 GPU 指標,請完成以下步驟:
- 在每個 VM 上設定 GPU 指標回報指令碼。這個指令碼會安裝 GPU 指標回報代理程式。這個代理程式會在 VM 上定期執行,以收集 GPU 資料,並將這項資料傳送至 Cloud Monitoring。
- 在每個 VM 上執行指令碼。
- 在每個 VM 上,將 GPU 指標回報代理程式設為在啟動時自動啟動。
- 在 Google Cloud Cloud Monitoring 中查看記錄。
必要的角色
如要監控 Windows VM 的 GPU 效能,您必須將必要的 Identity and Access Management (IAM) 角色授予下列主體:
- VM 執行個體使用的服務帳戶
- 您的使用者帳戶
為確保您和 VM 的服務帳戶具備必要權限,能監控 Windows VM 的 GPU 效能,請要求管理員將專案的下列 IAM 角色授予您和 VM 的服務帳戶:
-
Compute 執行個體管理員 (v1) (
roles/compute.instanceAdmin.v1) -
Monitoring 指標寫入者 (
roles/monitoring.metricWriter)
如要進一步瞭解如何授予角色,請參閱「管理專案、資料夾和機構的存取權」。
管理員或許也能透過自訂角色或其他預先定義的角色,將必要權限授予您和 VM 的服務帳戶。
設定 GPU 指標回報指令碼
需求條件
檢查每個 VM 是否符合下列要求:
- 每個 VM 都必須連結 GPU。
- 每個 VM 都必須安裝 GPU 驅動程式。
下載指令碼
以管理員身分開啟 PowerShell 終端機,然後使用 Invoke-WebRequest 指令下載指令碼。
Invoke-WebRequest 適用於 PowerShell 3.0 以上版本。Google Cloud 建議使用 ctrl+v 貼上複製的程式碼區塊。
mkdir c:\google-scripts
cd c:\google-scripts
Invoke-Webrequest -uri https://raw.githubusercontent.com/GoogleCloudPlatform/compute-gpu-monitoring/main/windows/gce-gpu-monitoring-cuda.ps1 -outfile gce-gpu-monitoring-cuda.ps1
執行指令碼
cd c:\google-scripts
.\gce-gpu-monitoring-cuda.ps1
將代理程式設為在開機時自動啟動
如要確保 GPU 指標回報代理程式在系統啟動時執行,請使用下列指令將代理程式新增至 Windows 工作排程器。
$Trigger= New-ScheduledTaskTrigger -AtStartup
$Trigger.ExecutionTimeLimit = "PT0S"
$User= "NT AUTHORITY\SYSTEM"
$Action= New-ScheduledTaskAction -Execute "PowerShell.exe" -Argument "C:\google-scripts\gce-gpu-monitoring-cuda.ps1"
$settingsSet = New-ScheduledTaskSettingsSet
# Set the Execution Time Limit to unlimited on all versions of Windows Server
$settingsSet.ExecutionTimeLimit = 'PT0S'
Register-ScheduledTask -TaskName "MonitoringGPUs" -Trigger $Trigger -User $User -Action $Action -Force -Settings $settingsSet
在 Cloud Monitoring 中查看指標
前往 Google Cloud 控制台的「Metrics Explorer」頁面。
展開「選取指標」選單。
在「資源」選單中,選取「VM 執行個體」。
在「指標類別」選單中,選取「自訂」。
在「指標」選單中,選取要繪製圖表的指標。例如
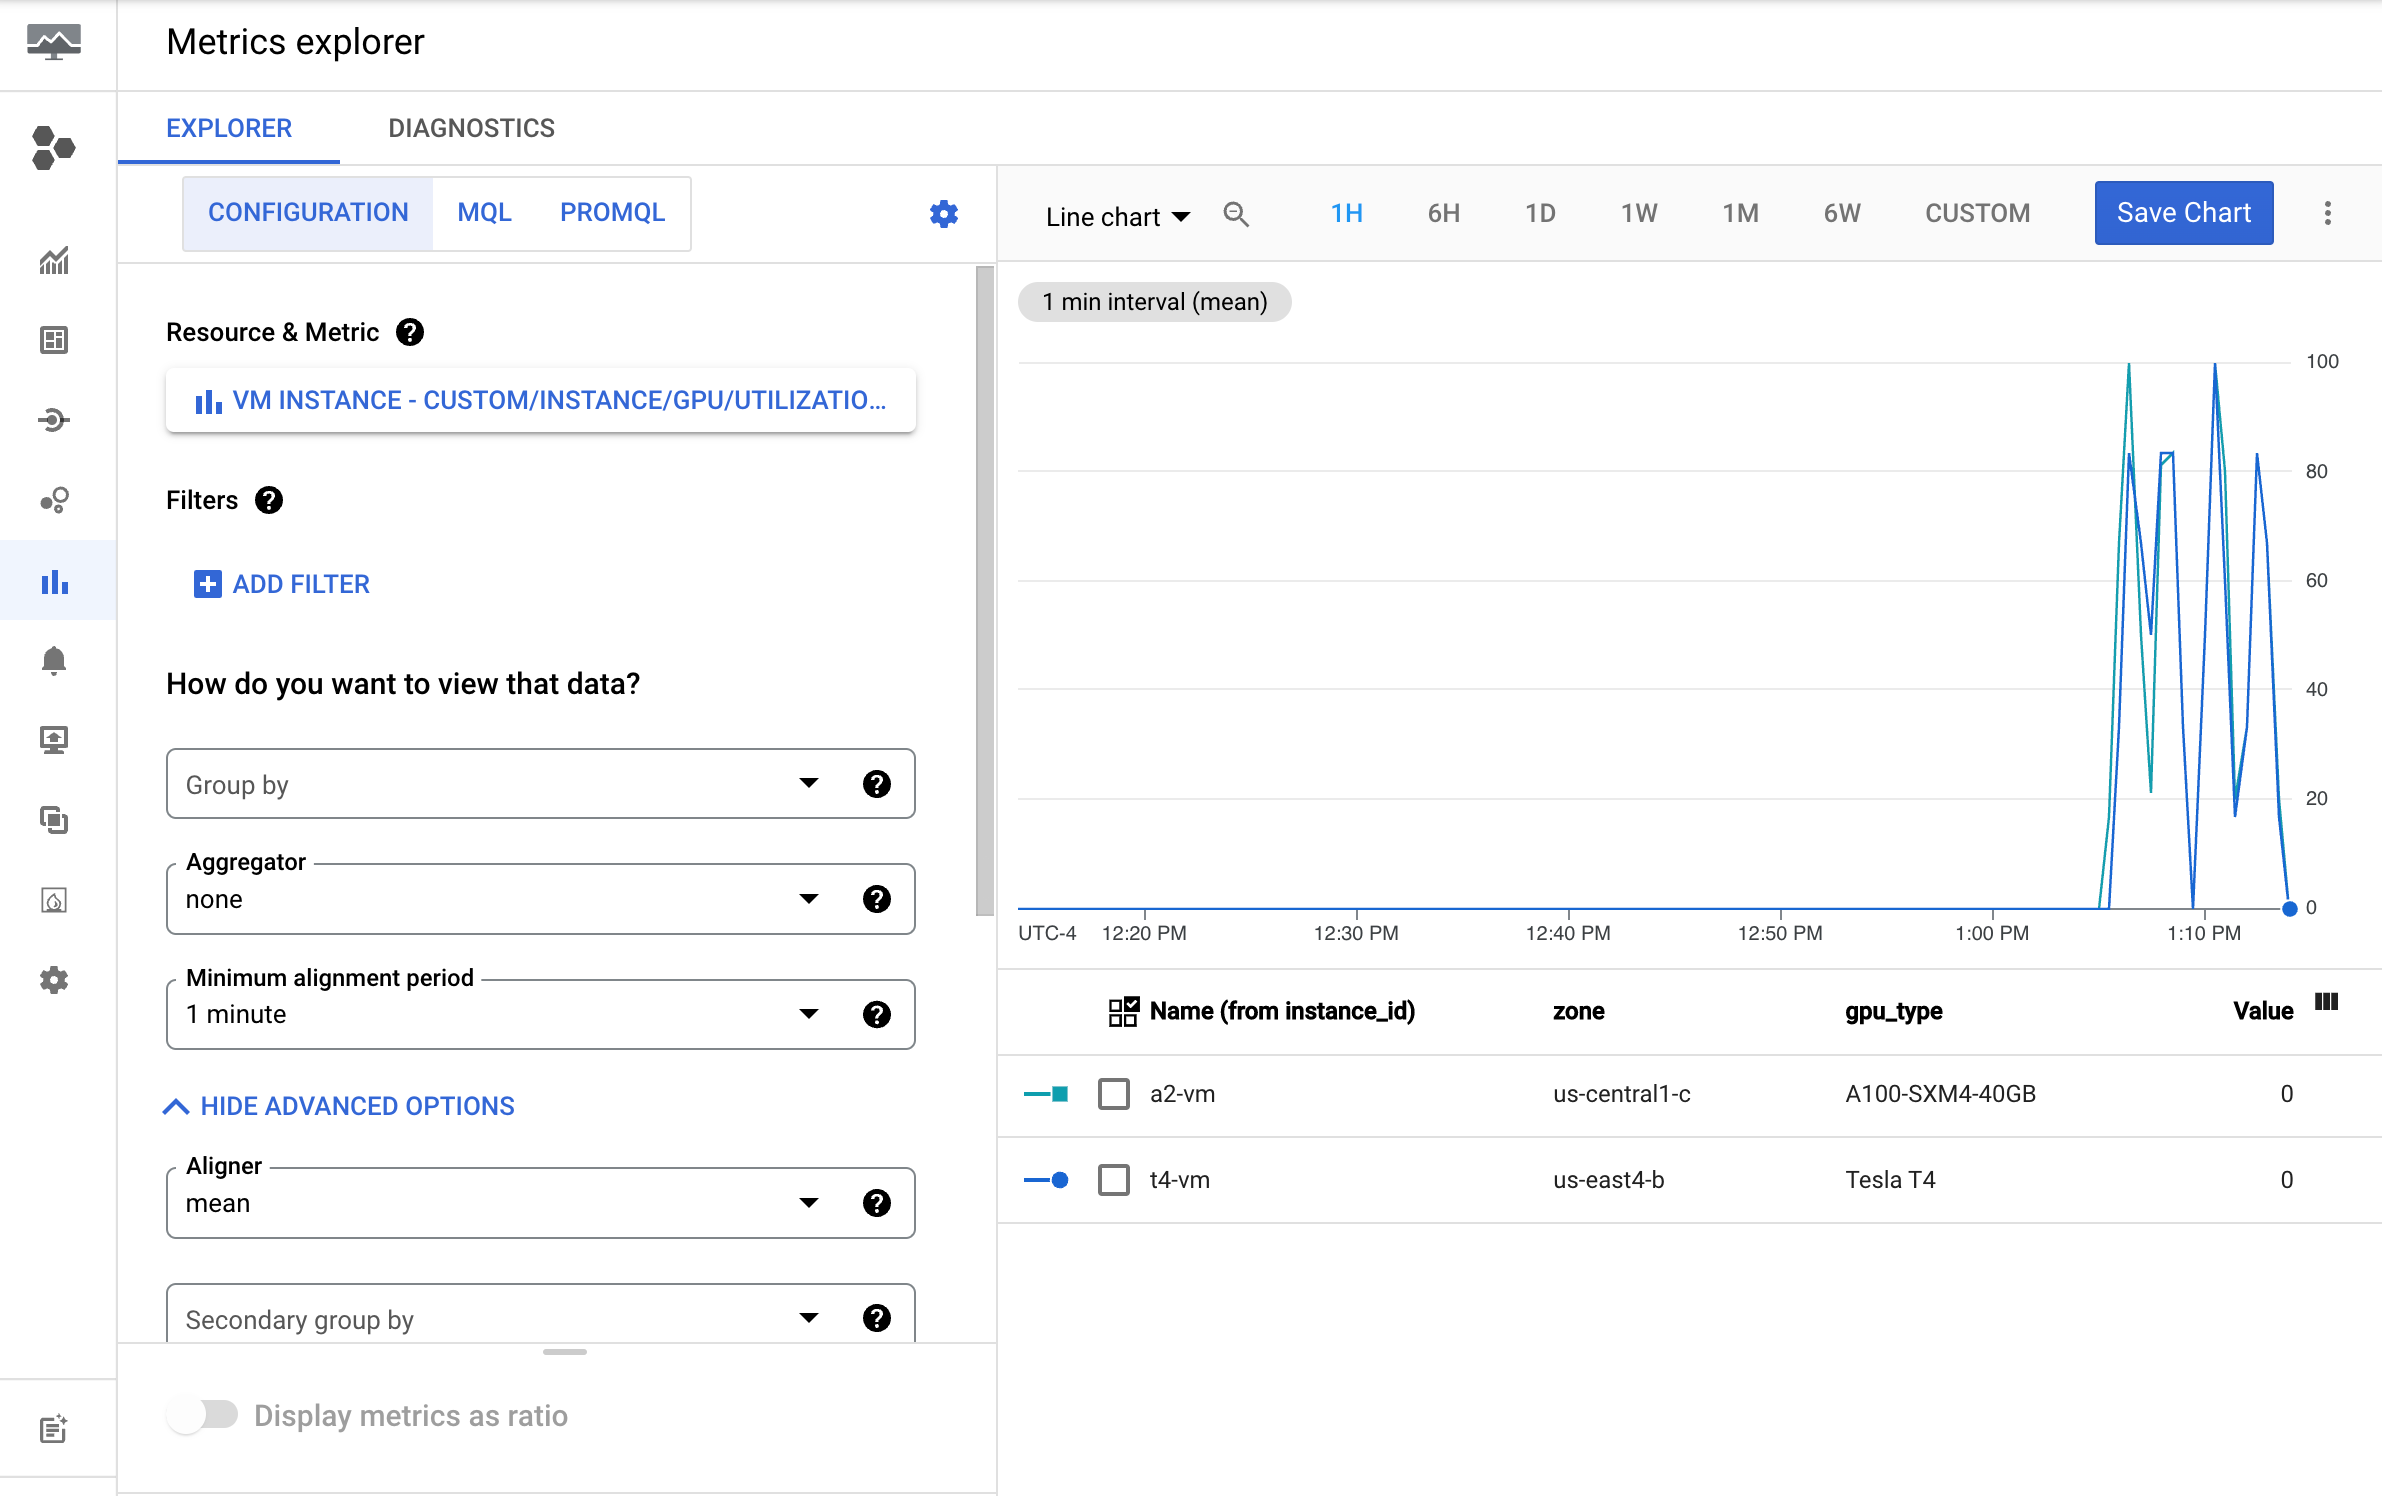
custom/instance/gpu/utilization。按一下 [套用]。
您的 GPU 使用率應如以下輸出內容所示:
可用的指標
| 指標名稱 | 說明 |
|---|---|
instance/gpu/utilization |
過去取樣期間內,GPU 上執行一或多個核心的時間百分比。 |
instance/gpu/memory_utilization |
過去取樣期間內,讀取或寫入全域 (裝置) 記憶體的時間百分比。 |
instance/gpu/memory_total |
已安裝的 GPU 記憶體總量。 |
instance/gpu/memory_used |
有效內容分配的記憶體總量。 |
instance/gpu/memory_used_percent |
有效內容分配到的總記憶體百分比。範圍為 0 到 100。 |
instance/gpu/memory_free |
可用記憶體總量。 |
instance/gpu/temperature |
核心 GPU 溫度 (攝氏)。 |
後續步驟
- 如要處理 GPU 主機維護作業,請參閱「處理 GPU 主機維護事件」。
- 如要提升網路效能,請參閱「使用較高的網路頻寬」。