Tetap teratur dengan koleksi
Simpan dan kategorikan konten berdasarkan preferensi Anda.
Skema peristiwa Google SecOps
Di BigQuery, tabel yang disebut events menyimpan data peristiwa UDM.
Kolom hour_time_bucket mengidentifikasi partisi sebagai jam dalam sehari di
kolom UDM metadata.event_timestamp. Nilai di kolom hour_time_bucket
adalah stempel waktu per jam yang memiliki format: <YYYY-MM-DD HH:MM:SS UTC>. Berikut adalah contohnya:
2022-05-20 00.00.00 UTC
2022-05-20 01.00.00 UTC
2022-05-20 02.00.00 UTC
2022-05-20 03.00.00 UTC
Misalnya, nilai 2022-05-20 00:00:00 UTC memberi label pada data dengan stempel waktu peristiwa antara 2022-05-20 00:00:00 UTC dan 2022-05-20 00:59:59 UTC. Untuk mengetahui informasi selengkapnya, lihat
Membuat kueri tabel berpartisi.
Jumlah waktu yang diperlukan agar data muncul di tabel events bergantung
pada perbedaan antara saat perangkat merekam peristiwa, metadata.event_timestamp,
dan saat peristiwa tersebut ditransfer ke SIEM Google Security Operations, metadata.ingested_timestamp.
Berikut adalah ringkasan waktu yang diperlukan agar data muncul di tabel events setelah diterima oleh Google Security Operations:
Jika perbedaannya kurang dari dua jam, data akan muncul sekitar
2 jam setelah diserap.
Jika perbedaannya antara 2 jam dan 24 jam, mungkin perlu waktu hingga 4 jam agar data muncul setelah ditransfer.
Jika perbedaannya lebih dari 24 jam, mungkin perlu waktu hingga 5 hari agar data muncul setelah ditransfer.
Skema tabel events berubah secara berkala. Untuk melihat informasi tentang tabel, termasuk skema saat ini, lihat petunjuk BigQuery untuk mendapatkan informasi tabel.
Untuk mengakses skema events, lakukan hal berikut:
Buka Google Cloud konsol, lalu pilih project ID Google SecOps
yang diberikan oleh perwakilan Google SecOps kepada Anda.
Pilih BigQuery > BigQuery Studio > datalake > events.
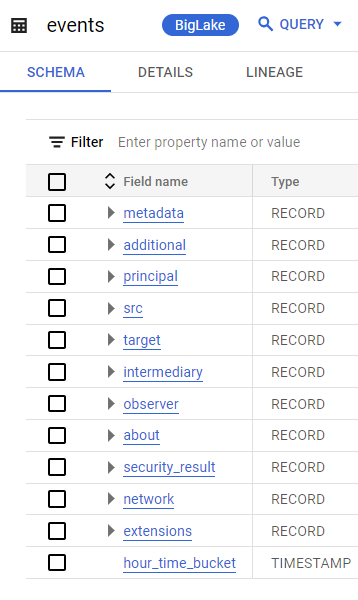
Gambar: Tabel events di BigQuery
Model data Events untuk dasbor
Di dasbor tersemat Google SecOps, Anda akan melihat struktur data yang disebut Peristiwa UDM.
Ini adalah model data Looker yang dibuat untuk tabel events di BigQuery.
Tabel ini mencakup kolom UDM yang paling umum digunakan. Laporan ini tidak menyertakan semua kolom UDM. Jika ada kolom UDM yang tidak ada dan harus disertakan ke dalam dasbor yang dipersonalisasi, hubungi perwakilan Google SecOps Anda.
Untuk melihat kolom di Jelajahi ini, lakukan langkah-langkah berikut:
Di menu navigasi, klik Dasbor.
Buat dasbor baru (klik Tambahkan > Buat Baru) atau edit dasbor yang ada.
Tambahkan Kartu.
Pilih Visualisasi sebagai jenis jika diminta.
Dalam daftar tabel, pilih Peristiwa UDM.
Jelajahi daftar kolom.
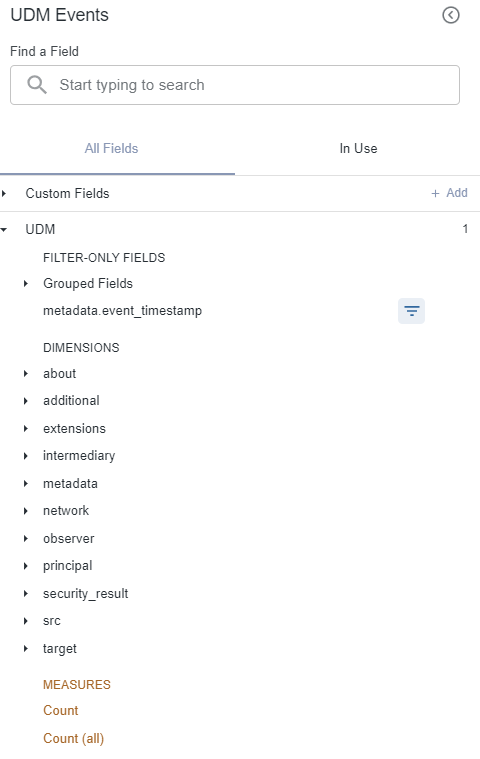
Gambar: Daftar kolom dalam model data Peristiwa Google SecOps
[[["Mudah dipahami","easyToUnderstand","thumb-up"],["Memecahkan masalah saya","solvedMyProblem","thumb-up"],["Lainnya","otherUp","thumb-up"]],[["Sulit dipahami","hardToUnderstand","thumb-down"],["Informasi atau kode contoh salah","incorrectInformationOrSampleCode","thumb-down"],["Informasi/contoh yang saya butuhkan tidak ada","missingTheInformationSamplesINeed","thumb-down"],["Masalah terjemahan","translationIssue","thumb-down"],["Lainnya","otherDown","thumb-down"]],["Terakhir diperbarui pada 2025-09-04 UTC."],[[["\u003cp\u003eThe \u003cem\u003eevents\u003c/em\u003e table in BigQuery stores UDM event records from Google Security Operations, partitioned hourly, based on the \u003ccode\u003emetadata.event_timestamp\u003c/code\u003e UDM field and identified by the \u003ccode\u003ehour_time_bucket\u003c/code\u003e field.\u003c/p\u003e\n"],["\u003cp\u003eData in the \u003cem\u003eevents\u003c/em\u003e table may take anywhere from 2 hours to 5 days to appear after it is ingested by Google Security Operations, depending on the time difference between the device recording the event and when Google Security Operations receives the event.\u003c/p\u003e\n"],["\u003cp\u003eThe \u003cem\u003eUDM Events\u003c/em\u003e data structure, found in Google Security Operations embedded dashboards, is a Looker data model representing the \u003cem\u003eevents\u003c/em\u003e table in BigQuery, containing the most commonly used UDM fields.\u003c/p\u003e\n"],["\u003cp\u003eTo view the most recent schema of the \u003ccode\u003eevents\u003c/code\u003e table, you need to go to the Google Cloud console, select BigQuery, and then select the datalake > events.\u003c/p\u003e\n"],["\u003cp\u003eMissing fields that you want in your dashboard need to be requested from your Google Security Operations representative.\u003c/p\u003e\n"]]],[],null,["# Google SecOps events schema\n===========================\n\nIn BigQuery, the table called *events* stores UDM event records.\n\nThe `hour_time_bucket` field identifies the partition as the hour of day in the\n`metadata.event_timestamp` UDM field. Values in the *hour_time_bucket* field\nare hourly time stamps that take the form: *\\\u003cYYYY-MM-DD HH:MM:SS UTC\\\u003e*. Here are examples:\n\n- 2022-05-20 00:00:00 UTC\n- 2022-05-20 01:00:00 UTC\n- 2022-05-20 02:00:00 UTC\n- 2022-05-20 03:00:00 UTC\n\nFor example, the value *2022-05-20 00:00:00 UTC* labels data with an event_timestamp between 2022-05-20 **00:00:00** UTC and 2022-05-20 **00:59:59** UTC. For more information, see\n[Query partitioned tables](/bigquery/docs/querying-partitioned-tables).\n\nThe amount of time it takes for data to appear in the `events` table depends\non the difference between when the device records the event, the `metadata.event_timestamp`,\nand when that event is ingested to Google Security Operations SIEM, the `metadata.ingested_timestamp`.\n\nThe following summarizes the time it takes for data to appear in the `events` table after it is received by Google Security Operations:\n\n- If the difference is less than two hours, then data appears approximately 2 hours after it is ingested.\n- If the difference is between 2 hours and 24 hours, it may take up to 4 hours for data to appear after it is ingested.\n- If the difference is more than 24 hours, it may take up to 5 days for data to appear after it is ingested.\n\nThe `events` table schema changes regularly. To view information about the table,\nincluding the current schema, see the BigQuery instructions for [getting table information](/bigquery/docs/tables#get_table_information).\n\nTo access the `events` schema, do the following:\n\n1. Open the Google Cloud console, and then select the Google SecOps project ID that your Google SecOps representative provided shared with you.\n2. Select **BigQuery** \\\u003e **BigQuery Studio** \\\u003e **datalake** \\\u003e **events**.\n\n **Figure: `events` table in BigQuery**\n\n`Events` data model for dashboards\n----------------------------------\n\nIn Google SecOps embedded dashboards, you'll notice the data structure called *UDM Events* .\nThis is a Looker data model created for the `events` table in BigQuery.\n\nThe table includes the most commonly used UDM fields. It does not include all UDM\nfields. If there are missing UDM fields you need to have incorporated into a\npersonalized dashboard, contact your Google SecOps representative.\n\nTo view fields in this Explore, perform the following steps:\n\n1. In the navigation bar, click **Dashboards**.\n2. Create a new dashboard (click **Add \\\u003e Create New**) or edit an existing dashboard.\n3. Add a Tile.\n4. Select **Visualization** as the type if prompted.\n5. In the list of tables, select **UDM Events**.\n6. Browse the list of fields.\n\n **Figure: Field list in Google SecOps Events data model**\n\nWhat's next\n-----------\n\n- View a description of each UDM field in the [Unified Data Model field list](/chronicle/docs/reference/udm-field-list).\n- For information about accessing and running queries in BigQuery, see [Run interactive and batch query jobs](/bigquery/docs/running-queries).\n- For information about how to query partitioned tables, see [Query partitioned tables](/bigquery/docs/querying-partitioned-tables).\n- For information about how to connect Looker to BigQuery, see Looker documentation about [connecting to BigQuery](/looker/docs/db-config-google-bigquery).\n- Information about how to [query partitioned tables](/bigquery/docs/querying-partitioned-tables)."]]