Mit Sammlungen den Überblick behalten
Sie können Inhalte basierend auf Ihren Einstellungen speichern und kategorisieren.
Google SecOps-Ereignisschema
In BigQuery werden UDM-Ereignisdatensätze in der Tabelle events gespeichert.
Das Feld hour_time_bucket identifiziert die Partition als die Uhrzeit im UDM-Feld metadata.event_timestamp. Die Werte im Feld hour_time_bucket sind stündliche Zeitstempel im Format <TT.MM.JJJJ HH:MM:SS UTC>. Hier einige Beispiele:
2022-05-20 00:00:00 UTC
2022-05-20 01:00:00 UTC
2022-05-20 02:00:00 UTC
2022-05-20 03:00:00 UTC
Mit dem Wert 2022-05-20 00:00:00 UTC werden beispielsweise Daten mit einem „event_timestamp“ zwischen dem 20. Mai 2022 00:00:00 UTC und dem 20. Mai 2022 00:59:59 UTC gekennzeichnet. Weitere Informationen finden Sie unter Partitionierte Tabellen abfragen.
Wie lange es dauert, bis Daten in der Tabelle events angezeigt werden, hängt davon ab, wie viel Zeit zwischen dem Zeitpunkt vergeht, zu dem das Gerät das Ereignis aufzeichnet (metadata.event_timestamp), und dem Zeitpunkt, zu dem das Ereignis in die SIEM von Google Security Operations aufgenommen wird (metadata.ingested_timestamp).
Unten finden Sie eine Zusammenfassung der Zeit, die vergeht, bis Daten in der Tabelle events angezeigt werden, nachdem sie von Google Security Operations empfangen wurden:
Bei einer Differenz von weniger als zwei Stunden werden die Daten etwa zwei Stunden nach der Datenaufnahme angezeigt.
Wenn der Unterschied zwischen 2 Stunden und 24 Stunden liegt, kann es nach der Datenaufnahme bis zu 4 Stunden dauern, bis sie angezeigt werden.
Wenn der Unterschied mehr als 24 Stunden beträgt, kann es nach der Datenaufnahme bis zu 5 Tage dauern, bis sie angezeigt werden.
Das Tabellenschema von events ändert sich regelmäßig. Informationen zur Tabelle, einschließlich des aktuellen Schemas, finden Sie in der BigQuery-Anleitung zum Abrufen von Tabelleninformationen.
So greifen Sie auf das events-Schema zu:
Öffnen Sie die Google Cloud Console und wählen Sie die Google SecOps-Projekt-ID aus, die Ihnen Ihr Google SecOps-Ansprechpartner mitgeteilt hat.
Wählen Sie BigQuery > BigQuery Studio > Datensee > Ereignisse aus.
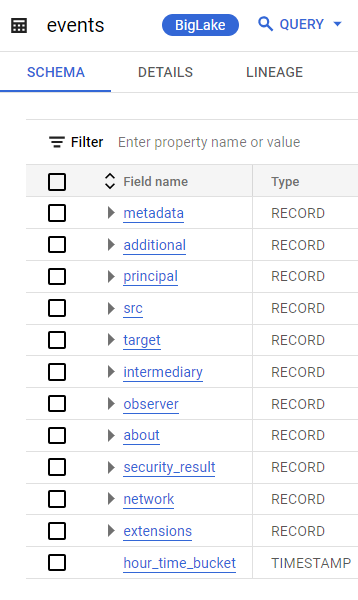
Abbildung: Tabelle events in BigQuery
Events-Datenmodell für Dashboards
In den eingebetteten Dashboards von Google SecOps sehen Sie die Datenstruktur UDM-Ereignisse.
Dies ist ein Looker-Datenmodell, das für die Tabelle events in BigQuery erstellt wurde.
Die Tabelle enthält die am häufigsten verwendeten UDM-Felder. Es enthält nicht alle UDM-Felder. Wenn UDM-Felder fehlen, die in ein personalisiertes Dashboard aufgenommen werden müssen, wenden Sie sich an Ihren Google SecOps-Ansprechpartner.
So rufen Sie Felder in diesem Explore auf:
Klicken Sie in der Navigationsleiste auf Dashboards.
Erstellen Sie ein neues Dashboard (klicken Sie auf Hinzufügen > Neu erstellen) oder bearbeiten Sie ein vorhandenes Dashboard.
Fügen Sie eine Kachel hinzu.
Wählen Sie bei Aufforderung Visualisierung als Typ aus.
Wählen Sie in der Liste der Tabellen UDM-Ereignisse aus.
Sehen Sie sich die Liste der Felder an.
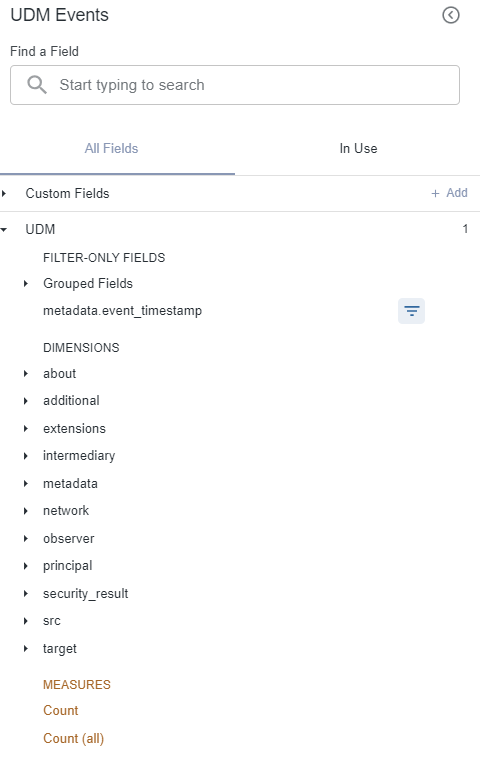
Abbildung: Feldliste im Datenmodell für Google SecOps-Ereignisse
[[["Leicht verständlich","easyToUnderstand","thumb-up"],["Mein Problem wurde gelöst","solvedMyProblem","thumb-up"],["Sonstiges","otherUp","thumb-up"]],[["Schwer verständlich","hardToUnderstand","thumb-down"],["Informationen oder Beispielcode falsch","incorrectInformationOrSampleCode","thumb-down"],["Benötigte Informationen/Beispiele nicht gefunden","missingTheInformationSamplesINeed","thumb-down"],["Problem mit der Übersetzung","translationIssue","thumb-down"],["Sonstiges","otherDown","thumb-down"]],["Zuletzt aktualisiert: 2025-09-02 (UTC)."],[[["\u003cp\u003eThe \u003cem\u003eevents\u003c/em\u003e table in BigQuery stores UDM event records from Google Security Operations, partitioned hourly, based on the \u003ccode\u003emetadata.event_timestamp\u003c/code\u003e UDM field and identified by the \u003ccode\u003ehour_time_bucket\u003c/code\u003e field.\u003c/p\u003e\n"],["\u003cp\u003eData in the \u003cem\u003eevents\u003c/em\u003e table may take anywhere from 2 hours to 5 days to appear after it is ingested by Google Security Operations, depending on the time difference between the device recording the event and when Google Security Operations receives the event.\u003c/p\u003e\n"],["\u003cp\u003eThe \u003cem\u003eUDM Events\u003c/em\u003e data structure, found in Google Security Operations embedded dashboards, is a Looker data model representing the \u003cem\u003eevents\u003c/em\u003e table in BigQuery, containing the most commonly used UDM fields.\u003c/p\u003e\n"],["\u003cp\u003eTo view the most recent schema of the \u003ccode\u003eevents\u003c/code\u003e table, you need to go to the Google Cloud console, select BigQuery, and then select the datalake > events.\u003c/p\u003e\n"],["\u003cp\u003eMissing fields that you want in your dashboard need to be requested from your Google Security Operations representative.\u003c/p\u003e\n"]]],[],null,["# Google SecOps events schema\n===========================\n\nIn BigQuery, the table called *events* stores UDM event records.\n\nThe `hour_time_bucket` field identifies the partition as the hour of day in the\n`metadata.event_timestamp` UDM field. Values in the *hour_time_bucket* field\nare hourly time stamps that take the form: *\\\u003cYYYY-MM-DD HH:MM:SS UTC\\\u003e*. Here are examples:\n\n- 2022-05-20 00:00:00 UTC\n- 2022-05-20 01:00:00 UTC\n- 2022-05-20 02:00:00 UTC\n- 2022-05-20 03:00:00 UTC\n\nFor example, the value *2022-05-20 00:00:00 UTC* labels data with an event_timestamp between 2022-05-20 **00:00:00** UTC and 2022-05-20 **00:59:59** UTC. For more information, see\n[Query partitioned tables](/bigquery/docs/querying-partitioned-tables).\n\nThe amount of time it takes for data to appear in the `events` table depends\non the difference between when the device records the event, the `metadata.event_timestamp`,\nand when that event is ingested to Google Security Operations SIEM, the `metadata.ingested_timestamp`.\n\nThe following summarizes the time it takes for data to appear in the `events` table after it is received by Google Security Operations:\n\n- If the difference is less than two hours, then data appears approximately 2 hours after it is ingested.\n- If the difference is between 2 hours and 24 hours, it may take up to 4 hours for data to appear after it is ingested.\n- If the difference is more than 24 hours, it may take up to 5 days for data to appear after it is ingested.\n\nThe `events` table schema changes regularly. To view information about the table,\nincluding the current schema, see the BigQuery instructions for [getting table information](/bigquery/docs/tables#get_table_information).\n\nTo access the `events` schema, do the following:\n\n1. Open the Google Cloud console, and then select the Google SecOps project ID that your Google SecOps representative provided shared with you.\n2. Select **BigQuery** \\\u003e **BigQuery Studio** \\\u003e **datalake** \\\u003e **events**.\n\n **Figure: `events` table in BigQuery**\n\n`Events` data model for dashboards\n----------------------------------\n\nIn Google SecOps embedded dashboards, you'll notice the data structure called *UDM Events* .\nThis is a Looker data model created for the `events` table in BigQuery.\n\nThe table includes the most commonly used UDM fields. It does not include all UDM\nfields. If there are missing UDM fields you need to have incorporated into a\npersonalized dashboard, contact your Google SecOps representative.\n\nTo view fields in this Explore, perform the following steps:\n\n1. In the navigation bar, click **Dashboards**.\n2. Create a new dashboard (click **Add \\\u003e Create New**) or edit an existing dashboard.\n3. Add a Tile.\n4. Select **Visualization** as the type if prompted.\n5. In the list of tables, select **UDM Events**.\n6. Browse the list of fields.\n\n **Figure: Field list in Google SecOps Events data model**\n\nWhat's next\n-----------\n\n- View a description of each UDM field in the [Unified Data Model field list](/chronicle/docs/reference/udm-field-list).\n- For information about accessing and running queries in BigQuery, see [Run interactive and batch query jobs](/bigquery/docs/running-queries).\n- For information about how to query partitioned tables, see [Query partitioned tables](/bigquery/docs/querying-partitioned-tables).\n- For information about how to connect Looker to BigQuery, see Looker documentation about [connecting to BigQuery](/looker/docs/db-config-google-bigquery).\n- Information about how to [query partitioned tables](/bigquery/docs/querying-partitioned-tables)."]]