The ML.VALIDATE_DATA_SKEW function
This document describes the ML.VALIDATE_DATA_SKEW function, which you can use
to compute the data skew between a model's training and serving data. This
function computes the statistics for the serving data, compares them to the
statistics that were computed for the training data at the time the model was
created, and identifies where there are anomalous differences between the two
data sets.
You can optionally visualize the function output by using Vertex AI model monitoring. For more information, see Monitoring visualization.
Statistics are only computed for feature columns in the serving data that match
feature columns in the training data, in order to achieve better performance and
lower cost. For models that were created with use of the
TRANSFORM clause,
the statistics are based on the raw feature data before feature preprocessing
within the TRANSFORM clause.
Syntax
ML.VALIDATE_DATA_SKEW(
  MODEL `PROJECT_ID.DATASET.MODEL_NAME`,
  { TABLE `PROJECT_ID.DATASET.TABLE_NAME` | (QUERY_STATEMENT) },
  STRUCT(
    [CATEGORICAL_DEFAULT_THRESHOLD AS categorical_default_threshold]
    [, CATEGORICAL_METRIC_TYPE AS categorical_metric_type]
    [, NUMERICAL_DEFAULT_THRESHOLD AS numerical_default_threshold]
    [, NUMERICAL_METRIC_TYPE AS numerical_metric_type]
    [, THRESHOLDS AS thresholds]
    [, ENABLE_VISUALIZATION_LINK AS enable_visualization_link])
)
Arguments
ML.VALIDATE_DATA_SKEW takes the following arguments:
PROJECT_ID: the BigQuery project that contains the resource.DATASET: the BigQuery dataset that contains the resource.MODEL_NAME: the name of the model.TABLE_NAME: the name of the input table that contains the serving data to calculate statistics for.QUERY_STATEMENT: a query that generates the serving data to calculate statistics for. For the supported SQL syntax of theQUERY_STATEMENTclause, see GoogleSQL query syntax.CATEGORICAL_DEFAULT_THRESHOLD: aFLOAT64value that specifies the custom threshold to use for anomaly detection for categorical andARRAY<categorical>features. The value must be in the range[0, 1). The default value is0.3.CATEGORICAL_METRIC_TYPE: aSTRINGvalue that specifies the metric used to compare statistics for categorical andARRAY<categorical>features. Valid values are as follows:L_INFTY: use L-infinity distance. This value is the default.JENSEN_SHANNON_DIVERGENCE: use Jensen–Shannon divergence.
NUMERICAL_DEFAULT_THRESHOLD: aFLOAT64value that specifies the custom threshold to use for anomaly detection for numerical,ARRAY<numerical>, andARRAY<STRUCT<INT64, numerical>>features. The value must be in the range[0, 1). The default value is0.3.NUMERICAL_METRIC_TYPE: aSTRINGvalue that specifies the metric used to compare statistics for numerical,ARRAY<numerical>, andARRAY<STRUCT<INT64, numerical>>features. The only valid value isJENSEN_SHANNON_DIVERGENCE.THRESHOLDS: anARRAY<STRUCT<STRING, FLOAT64>>value that specifies the anomaly detection thresholds for one or more columns for which you don't want to use the default threshold. TheSTRINGvalue in the struct specifies the column name, and theFLOAT64value specifies the threshold. TheFLOAT64value must be in the range[0, 1). For example,[('col_a', 0.1), ('col_b', 0.8)].ENABLE_VISUALIZATION_LINK: aBOOLvalue that determines whether to return links to the visualized function output. When you specifyTRUEfor this argument, theML.VALIDATE_DATA_DRIFToutput includes thevisualization_linkcolumn. Thevisualization_linkcolumn provides URLs that link to visualizations of the function results in Vertex AI monitoring.When you specify
TRUEfor this argument, themodelargument value must refer to a BigQuery ML model that is registered with Vertex AI. If the model isn't registered, an invalid query error is returned.
Output
ML.VALIDATE_DATA_SKEW returns one row for each column in the input data.
ML.VALIDATE_DATA_SKEW output contains the following columns:
input: aSTRINGcolumn that contains the input column name.metric: aSTRINGcolumn that contains the metric used to compare theinputcolumn statistical value between the training and serving data sets. This column value isJENSEN_SHANNON_DIVERGENCEfor numerical features, and eitherL_INFTYorJENSEN_SHANNON_DIVERGENCEfor categorical features.threshold: aFLOAT64column that contains the threshold used to determine whether the statistical difference in theinputcolumn value between the training and serving data is anomalous.value: aFLOAT64column that contains the statistical difference in theinputcolumn value between the serving and the training data sets.is_anomaly: aBOOLcolumn that indicates whether thevaluevalue is higher than thethresholdvalue.visualization_link: a URL that links to a Vertex AI visualization of the results for the given feature. The URL is formatted as follows:https://console.cloud.google.com/vertex-ai/model-monitoring/locations/region/model-monitors/vertex_model_monitor_id/model-monitoring-jobs/vertex_model_monitoring_job_id/feature-drift?project=project_id&featureName=feature_name
For example:
https://console.cloud.google.com/vertex-ai/model-monitoring/locations/us-central1/model-monitors/bq123456789012345647/model-monitoring-jobs/bqjob890123456789012/feature-drift?project=myproject&featureName=petal_lengthThis column is only returned when the
enable_visualization_linkargument value isTRUE.For more information, see Monitoring visualization.
Examples
The following examples demonstrate how to use the ML.VALIDATE_DATA_SKEW
function.
Run ML.VALIDATE_DATA_SKEW
The following example computes data skew between the serving data and the
training data used to create the model, with a categorical feature threshold
of 0.2:
SELECT *
FROM ML.VALIDATE_DATA_SKEW(
  MODEL `myproject.mydataset.mymodel`,
  TABLE `myproject.mydataset.serving`,
  STRUCT(0.2 AS categorical_default_threshold)
);
The output looks similar to the following:
+------------------+--------------------------+-----------+--------+------------+
| input            | metric                   | threshold |  value | is_anomaly |
+------------------+--------------------------+-----------+--------+------------+
| dropoff_latitude | JENSEN_SHANNON_DIVERGENCE| 0.2       | 0.7    | true       |
+------------------+--------------------------+-----------+--------+------------+
| payment_type     | L_INTFY                  | 0.3       | 0.2    | false      |
+------------------+--------------------------+-----------+--------+------------+
Run ML.VALIDATE_DATA_SKEW and visualize the results
The following example computes data skew between the serving data and the
training data used to create the model, with a categorical feature threshold
of 0.2:
SELECT *
FROM ML.VALIDATE_DATA_SKEW(
  MODEL `myproject.mydataset.mymodel`,
  TABLE `myproject.mydataset.serving`,
  STRUCT(0.2 AS categorical_default_threshold,
    TRUE AS enable_visualization_link)
);
The output looks similar to the following:
+------------------+--------------------------+-----------+--------+------------+--------------------------------------------------------+
| input            | metric                   | threshold |  value | is_anomaly | visualization_link                                     |
+------------------+--------------------------+-----------+--------+------------+--------------------------------------------------------+
| dropoff_latitude | JENSEN_SHANNON_DIVERGENCE| 0.2       | 0.7    | true       | https://console.cloud.google.com/vertex-ai/            |
|                  |                          |           |        |            | model-monitoring/locations/us-central1/model-monitors/ |
|                  |                          |           |        |            | bq1111222233334444555/model-monitoring-jobs/           |
|                  |                          |           |        |            | bqjob1234512345123451234/feature-drift?project=        |
|                  |                          |           |        |            | myproject&featureName=dropoff_latitude                 |
+------------------+--------------------------+-----------+--------+------------+--------------------------------------------------------+
| payment_type     | L_INTFY                  | 0.3       | 0.2    | false      | https://console.cloud.google.com/vertex-ai/            |
|                  |                          |           |        |            | model-monitoring/locations/us-central1/model-monitors/ |
|                  |                          |           |        |            | bq1111222233334444555/model-monitoring-jobs/           |
|                  |                          |           |        |            | bqjob1234512345123451234/feature-drift?project=        |
|                  |                          |           |        |            | myproject&featureName=payment_type                     |
+------------------+--------------------------+-----------+--------+------------+--------------------------------------------------------+
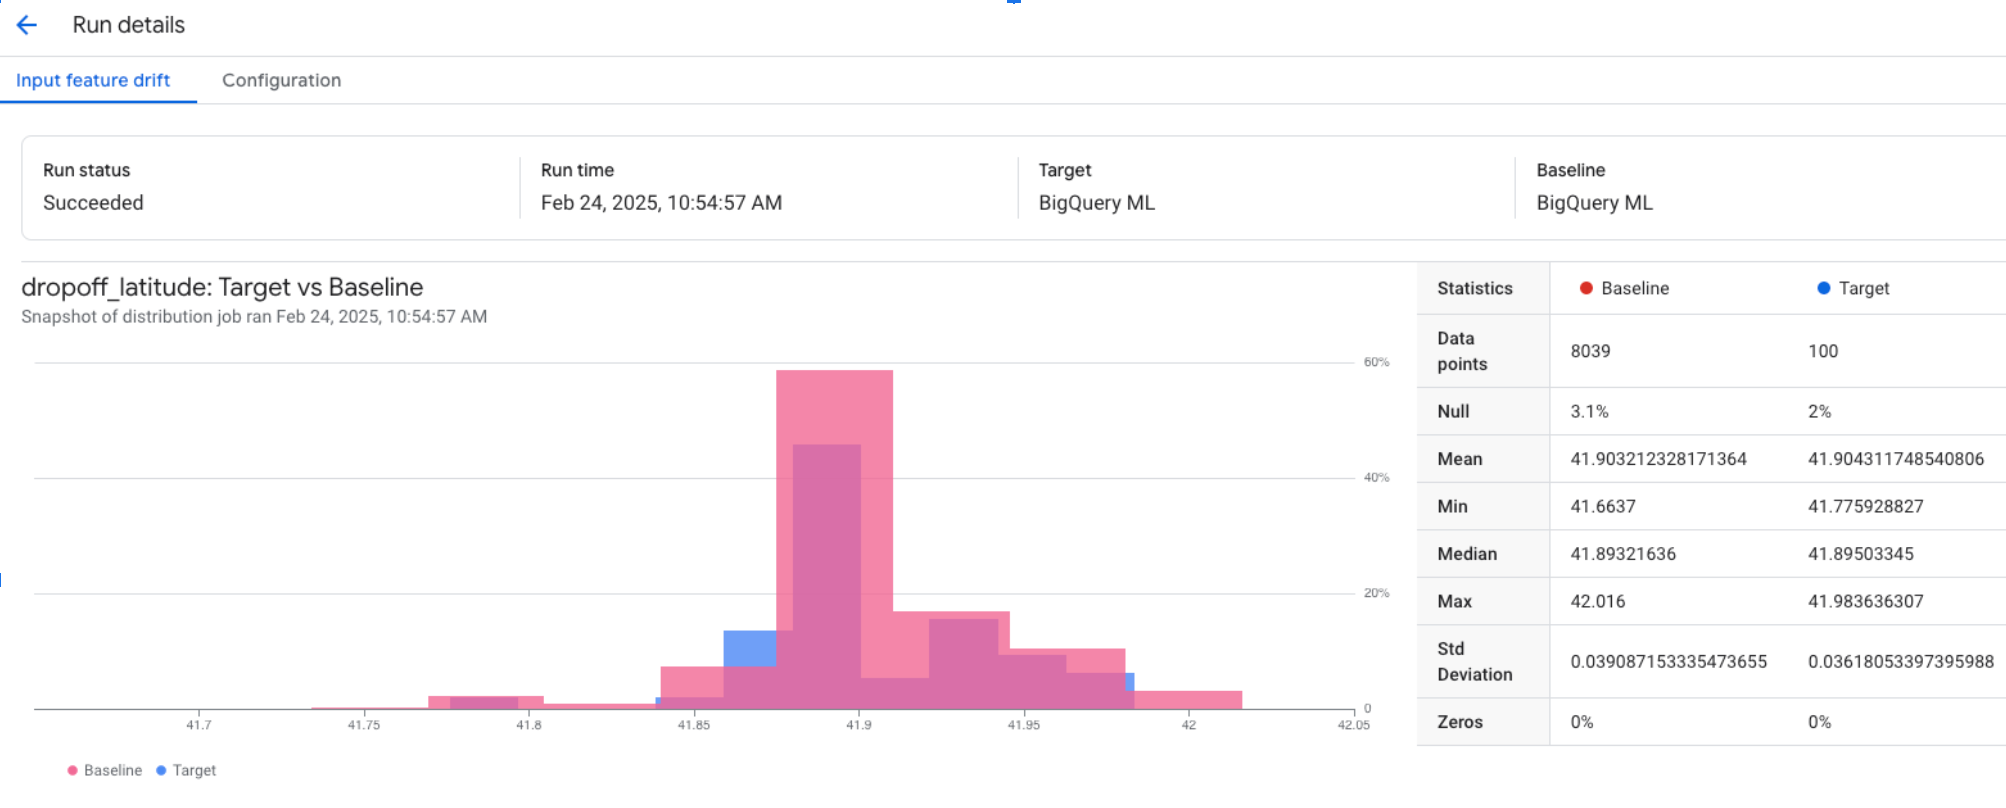
Copying and pasting the visualization link into a browser tab returns results similar to the following for numerical features:
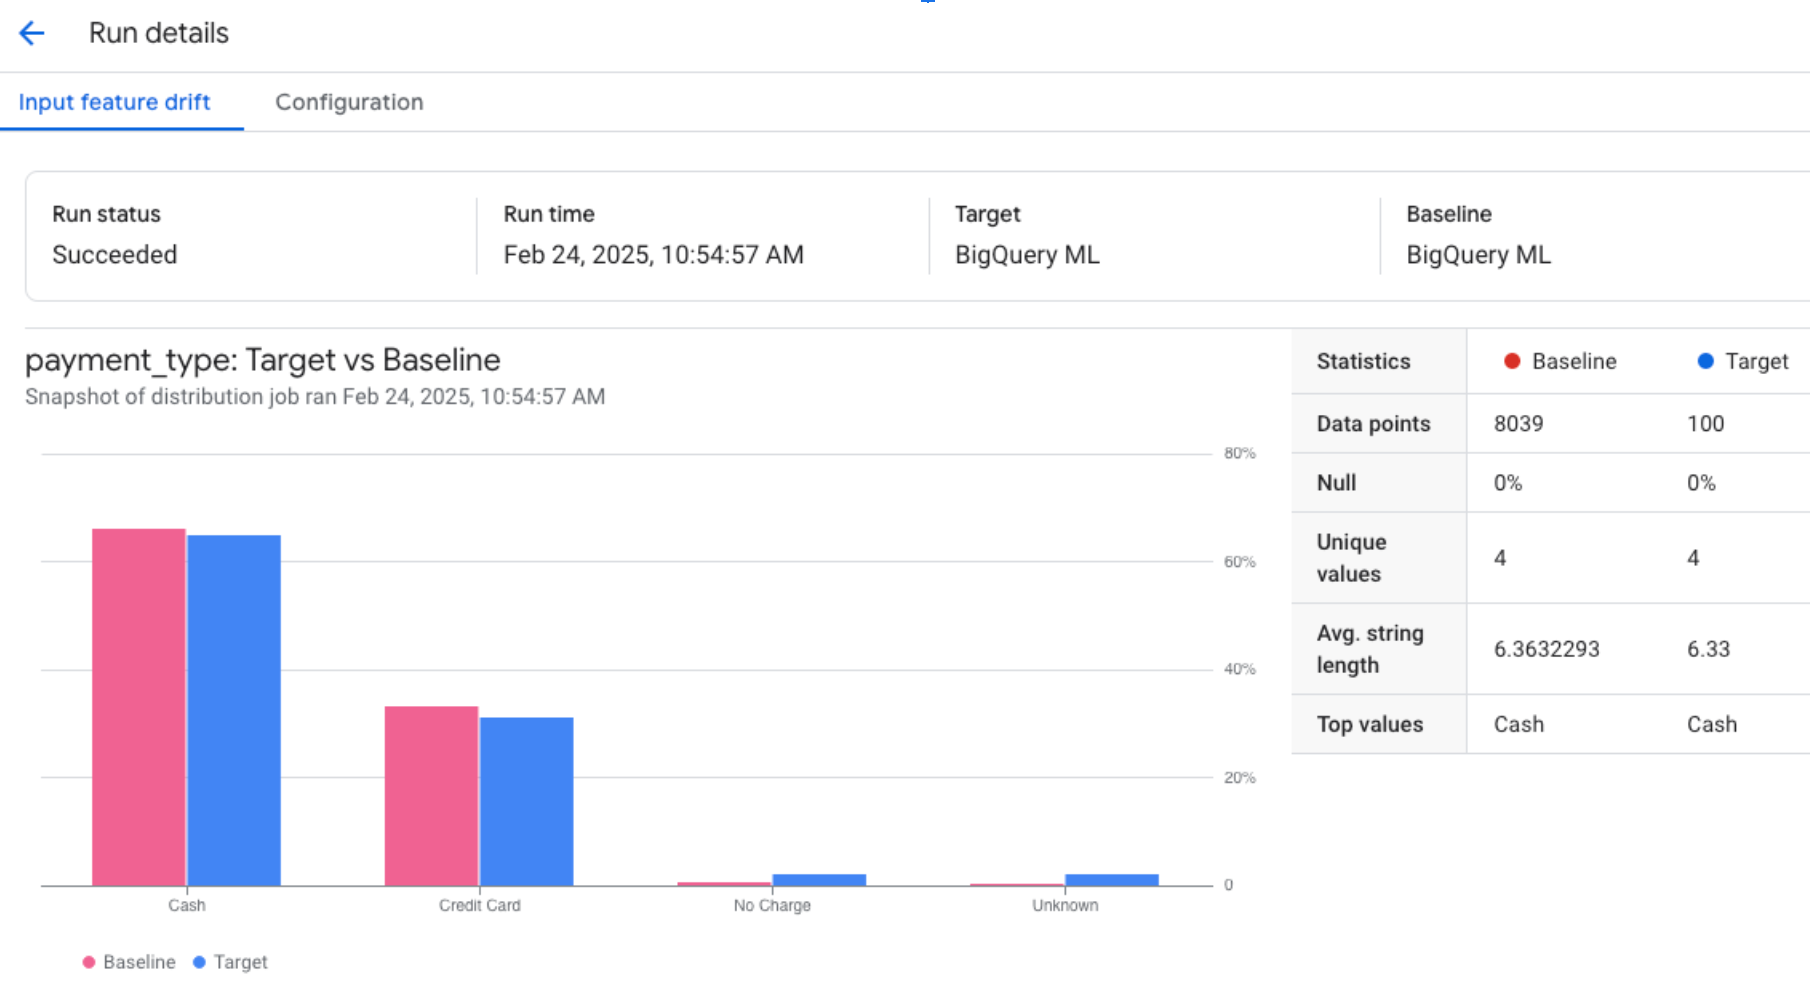
Copying and pasting the visualization link into a browser tab returns results similar to the following for categorical features:
Automate skew detection
The following example shows how to automate skew detection for a linear regression model:
DECLARE anomalies ARRAY<STRING>;

SET anomalies = (
  SELECT ARRAY_AGG(input)
  FROM
    ML.VALIDATE_DATA_SKEW(
      MODEL mydataset.model_linear_reg,
      TABLE mydataset.serving,
      STRUCT(
        0.3 AS categorical_default_threshold,
        0.2 AS numerical_default_threshold,
        'JENSEN_SHANNON_DIVERGENCE' AS numerical_metric_type,
        [STRUCT('fare', 0.15), STRUCT('company', 0.25)] AS thresholds))
  WHERE is_anomaly
);

IF(ARRAY_LENGTH(anomalies) > 0)
  THEN
    CREATE OR REPLACE MODEL mydataset.model_linear_reg
    TRANSFORM(
      ML.MIN_MAX_SCALER(fare) OVER() AS f1,
      ML.ROBUST_SCALER(pickup_longitude) OVER() AS f2,
      ML.LABEL_ENCODER(company) OVER() AS f3,
      ML.ONE_HOT_ENCODER(payment_type) OVER() AS f4,
      label
    )
    OPTIONS (
      model_type = 'linear_reg',
      max_iterations = 1)
    AS (
      SELECT
        fare,
        pickup_longitude,
        company,
        payment_type,
        2 AS label
      FROM mydataset.new_training_data
    );

    SELECT
      ERROR(
        CONCAT(
          "Found data skew in features: ",
          ARRAY_TO_STRING(anomalies, ", "),
          ". Model is retrained with the latest data."));
  ELSE
    SELECT *
    FROM
      ML.PREDICT(
        MODEL mydataset.model_linear_reg,
        TABLE mydataset.serving);
END IF;
Limitations
ML.VALIDATE_DATA_SKEWdoesn't support the following types of models:- AutoML
- Matrix factorization
ARIMA_PLUS- Remote models over LLMs, Cloud AI services, or Vertex AI endpoints
- Imported Open Neural Network Exchange (ONNX), TensorFlow, TensorFlow Lite, or XGBoost models
ML.VALIDATE_DATA_SKEWdoesn't support models created before March 28, 2024, or models that use theWARM STARToption. To enable use ofML.VALIDATE_DATA_SKEW, retrain the model by running theCREATE OR REPLACE modelstatement.Running the
ML.VALIDATE_DATA_SKEWfunction on a large amount of input data can cause the query to return the errorDry run query timed out. To resolve the error, disable retrieval of cached results for the query.ML.VALIDATE_DATA_SKEWdoesn't conduct schema validation between the two sets of input data, and so handles data type mismatches as follows:- If you specify
JENSEN_SHANNON_DIVERGENCEfor thecategorical_default_thresholdornumerical_default_thresholdargument, the feature isn't included in the final anomaly report. - If you specify
L_INFTYfor thecategorical_default_thresholdargument, the function outputs the computed feature distance as expected.
However, when you run inference on the serving data, the
ML.PREDICTfunction handles schema validation.- If you specify
Pricing
The ML.VALIDATE_DATA_SKEW function uses
BigQuery on-demand compute pricing.
What's next
- For more information about model monitoring in BigQuery ML, see Model monitoring overview.
- For more information about supported SQL statements and functions for ML models, see End-to-end user journeys for ML models.