本文档介绍了如何在 Vertex AI 中监控全托管式模型的行为、健康状况和性能。本文介绍了如何使用预构建的模型可观测性信息中心来深入了解模型使用情况、发现延迟问题并排查错误。
您将了解如何实现完成以下任务:
- 访问并解读模型可观测性信息中心。
- 查看可用的监控指标。
- 使用 Metrics Explorer 监控模型端点流量。
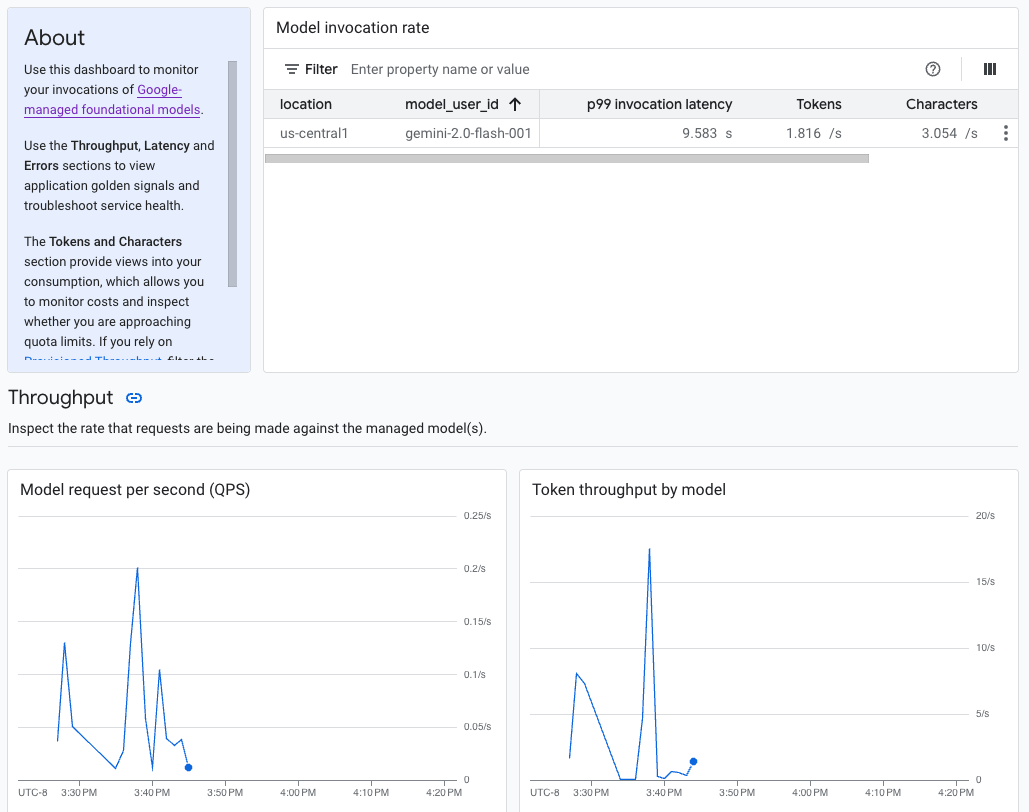
访问和解读模型可观测性信息中心
Vertex AI 上的生成式 AI 提供了一个预构建的模型可观测性信息中心,用于查看全托管式模型的行为、健康状况和性能。全托管式模型(也称为模型即服务 [MaaS])由 Google 提供,包括 Google 的 Gemini 模型和具有托管端点的合作伙伴模型。信息中心不包含来自自托管模型的指标。
Vertex AI 上的生成式 AI 会自动收集并报告 MaaS 模型的活动,以帮助您快速排查延迟问题并监控容量。
使用场景
作为应用开发者,您可以查看用户如何与您公开的模型进行互动。例如,您可以查看模型用量(每秒模型请求数)和用户提示的计算强度(模型调用延迟时间)随时间的趋势。因此,由于这些指标与模型用量相关,您还可以估算运行每个模型的费用。
出现问题时,您可以通过信息中心快速排查问题。您可以通过查看 API 错误率、第一个 token 延迟时间和 token 吞吐量,检查模型是否可靠且及时地进行回答。
可用的监控指标
模型可观测性信息中心会显示 Cloud Monitoring 收集的部分指标,例如每秒模型请求数 (QPS)、token 吞吐量和第一个 token 延迟时间。查看信息中心,查看所有可用指标。
限制
Vertex AI 仅会针对对模型端点的 API 调用捕获信息中心指标。 Google Cloud 控制台使用情况(例如 Vertex AI Studio 中的指标)不会添加到信息中心。
查看信息中心
- 在 Google Cloud 控制台的 Vertex AI 部分中,前往信息中心页面。
前往 Vertex AI 1. 在信息中心内,点击“模型可观测性”下方的显示所有指标,以便在 Google Cloud Observability 控制台中查看模型可观测性信息中心。
如需查看特定模型或特定位置的指标,请在信息中心页面顶部设置一个或多个过滤条件。
如需了解每个指标的说明,请参阅Google Cloud 指标页面上的“
aiplatform”部分。
监控模型端点流量
请按照以下说明在 Metrics Explorer 中监控端点的流量。
在 Google Cloud 控制台中,前往 Metrics Explorer 页面。
选择要查看指标的项目。
在指标下拉菜单中,点击选择指标。
在按资源或指标名称过滤搜索栏中,输入
Vertex AI Endpoint。选择 Vertex AI 端点 > 预测指标类别。在活跃指标下,选择以下任一指标:
prediction/online/error_countprediction/online/prediction_countprediction/online/prediction_latenciesprediction/online/response_count
点击应用。如需添加多个指标,请点击添加查询。
您可以使用以下下拉菜单过滤或汇总指标:
如需根据指定条件选择和查看部分数据,请使用过滤条件下拉菜单。 例如,如需过滤模型
gemini-2.0-flash-001,请使用endpoint_id = gemini-2p0-flash-001(请注意,模型版本中的.会替换为p)。如需将多个数据点合并为单个值并查看指标的摘要视图,请使用汇总下拉菜单。 例如,您可以汇总
response_code的总和。
您可以选择为端点设置提醒。如需了解详情,请参阅管理提醒政策。
如需查看您使用信息中心向项目添加的指标,请参阅信息中心概览。
后续步骤
- 如需了解如何为信息中心创建提醒,请参阅提醒概览。
- 如需了解指标数据保留,请参阅 Monitoring 配额和限制。
- 如需了解静态数据,请参阅保护静态数据。
- 如需查看 Cloud Monitoring 收集的所有指标的列表,请参阅Google Cloud 指标页面上的“
aiplatform”部分。