VM レベルの指標ダッシュボードには、プロジェクトの VM 固有の指標を表示するためのグラフが表示されます。次のアドレスからダッシュボードにアクセスします。
https://GDC_HOST/PROJECT/grafana/d/vm-metrics/workload-vms
- GDC_HOST は、ホスト名に置き換えます。
- PROJECT は、実際のプロジェクト名で置き換えます。
このページでは、VM ダッシュボードの概要と、そこからアクセスできるさまざまなグラフで提供される情報の種類について説明します。アラートの構成方法など、モニタリングと可視化の詳細については、次のページもご覧ください。
- オブザーバビリティのモニタリングと可視化: 指標の収集、指標の表示、ダッシュボードの管理の詳細について説明します。
- アラート: アラートやアラートルールの作成などに関する情報。
VM ダッシュボード
VM ダッシュボードには、プロジェクト Namespace の各 VM について、次の情報を含むグラフが表示されます。
これらのグラフタイプは、VM モニタリング指標を使用して生成されます。指標は、タイプ、ラベル、意味に従って名前が付けられ、説明されます。
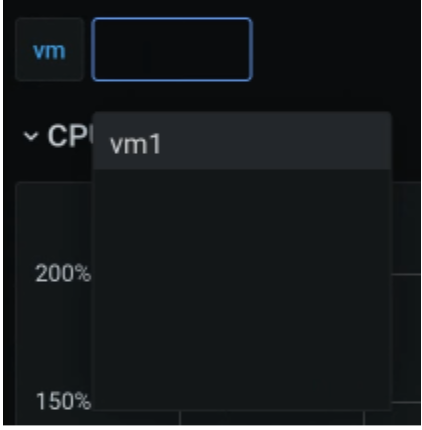
ダッシュボード ビューで、ページの上部にある選択ボックス(次の画像では「vm」とマークされています)から、モニタリングする VM を選択します。画像は、vm1 が選択されていることを示しています。
CPU
CPU 使用率(各 vCPU がさまざまな状態で費やした時間)を表示します。グラフには、マシンタイプで指定された各 vCPU の情報が表示されます。

メモリ
メモリグラフで、VM に割り当てられた合計メモリ、使用可能なメモリ容量、使用中のメモリ容量などの属性を確認します。

ネットワーク
[ネットワーク] ページでは、次の情報を確認できます。
- ネットワークから送受信されたパケット数。
- ネットワークから送受信されたバイト数。
- 仮想ネットワーク インターフェース カード(vNIC)インターフェースでドロップされた受信パケットと送信パケットの数。
- ネットワーク送信エラー パケット数。

ディスク
[ディスク] ページで、次の情報を確認します。
- ディスクからの読み取りまたはディスクへの書き込みのバイト数
- 書き込みまたは読み取りの IO オペレーションの数。
- 読み取りまたは書き込みオペレーションにかかった累積時間:
- オペレーションがキューに登録されている時間
- オペレーションの実際の実行時間(ディスクがビジー状態)
- ディスク フラッシュ リクエストの数と、キャッシュ フラッシュに費やされた時間。

指標の一覧
指標定義のリストを表示するには、[仮想マシン管理(VMM) ] ページでリストを表示します。