Stay organized with collections
Save and categorize content based on your preferences.
For Looker developers: The formatting shown on this page is the same as formatting used with the value_format LookML parameter, except that the value_format parameter requires the formatting string to be enclosed in double quotes.
Custom formatting gives you greater control over how numeric data appears in a Looker result set. With custom formatting, you can apply Excel-style formatting options to numeric data shown in visualizations, or produced by custom fields or table calculations.
Using custom formatting in visualizations
For visualizations with a Values tab in the gear menu:
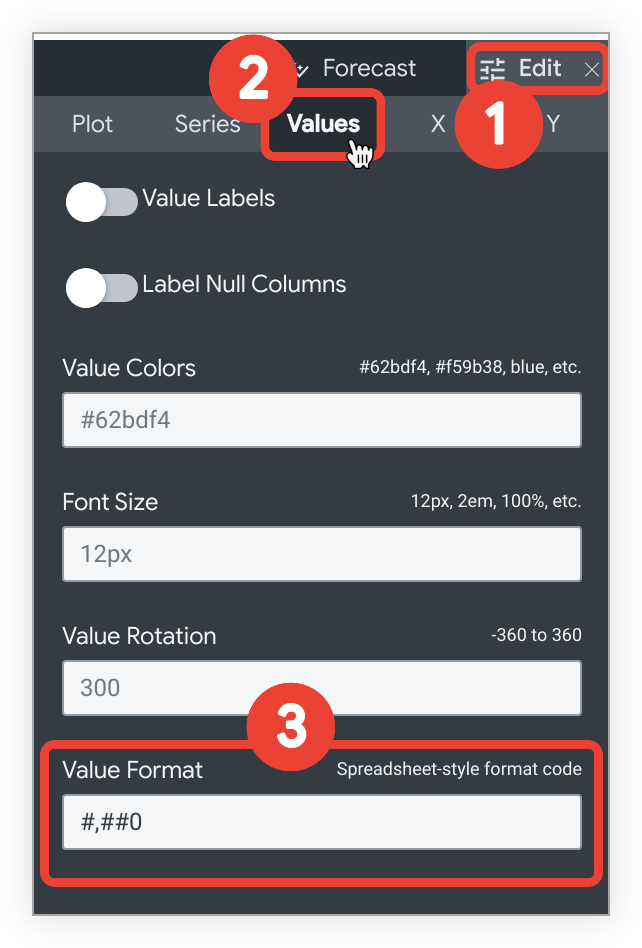
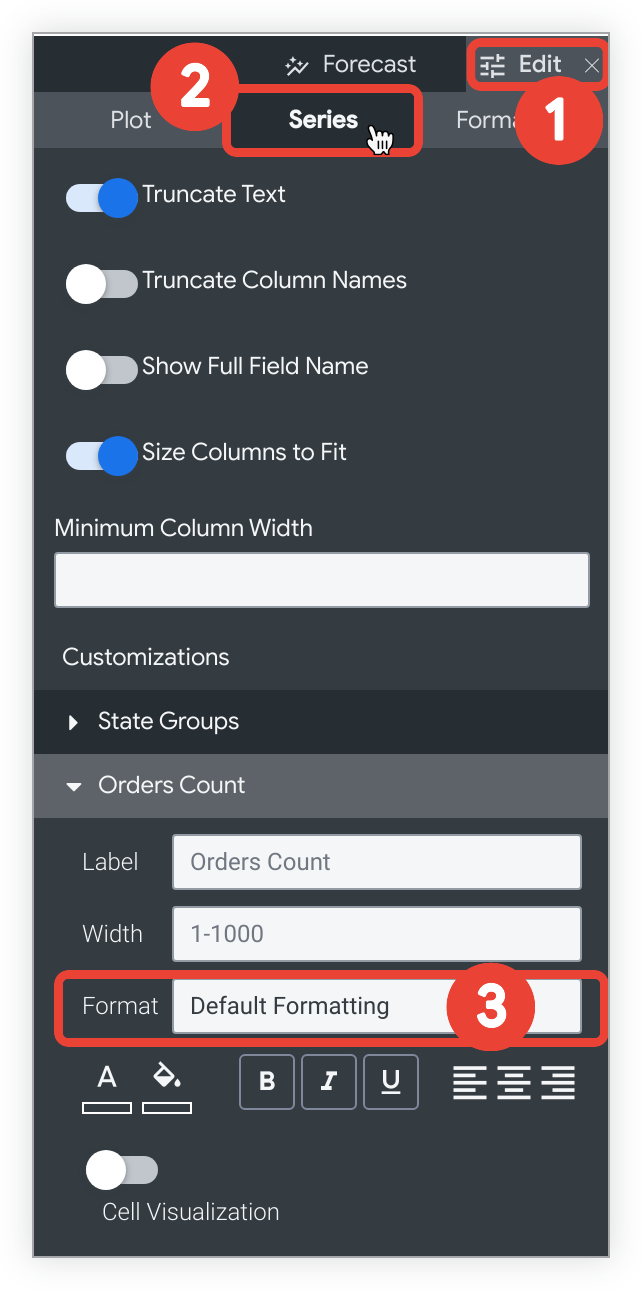
Select the Edit menu on the Visualization bar.
Select the Values tab.
In the Value Format field, enter the custom formatting string.
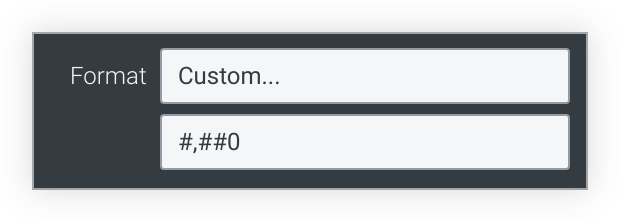
In the Customizations section, select the Format drop-down and choose Custom....
A new blank field will appear when you select Custom.... Enter the custom formatting string in the blank field.
Using custom formatting with table calculations and custom fields
When you create or edit a table calculation or custom field, select the Custom option in the Format drop-down and enter the custom format in the blank field.
Some of the most common formatting options are listed in the following table. A format code that uses 0 requires that non-significant zeros be displayed if the number contains fewer digits than specified in the code. A format code that uses # displays only the significant digits, even if there are fewer digits than specified in the code.
Some special characters, such as international currency symbols, must be treated as strings and enclosed in double quotes.
Format
Result
0
Integer (123)
00#
Integer zero-padded to 3 places (001)
0 "String"
Integer followed by a string (123 String)("String" can be replaced with any text string)
0.##
Number up to 2 decimals (1. or 1.2 or 1.23)
0.00
Number with exactly 2 decimals (1.23)
00#.00
Number zero-padded to 3 places and exactly 2 decimals (001.23)
#,##0
Number with comma between thousands (1,234)
#,##0.00
Number with comma between thousands and 2 decimals (1,234.00)
0.000,, "M"
Number in millions with 3 decimals (1.234 M)Division by 1 million happens automatically
0.000, "K"
Number in thousands with 3 decimals (1.234 K)Division by 1 thousand happens automatically
$0
Dollars with 0 decimals ($123)
$0.00
Dollars with 2 decimals ($123.00)
"€"0
Euros with 0 decimals (€123)
$#,##0.00
Dollars with comma between thousands and 2 decimals ($1,234.00)
$#.00;($#.00)
Dollars with 2 decimals, positive values displayed normally, negative values wrapped in parenthesis
0\%
Display as percent with 0 decimals (1 becomes 1%)
0.00\%
Display as percent with 2 decimals (1 becomes 1.00%)
0%
Convert to percent with 0 decimals (.01 becomes 1%)
0.00%
Convert to percent with 2 decimals (.01 becomes 1.00%)
Time formatting for charts
If your chart as a time dimension on the x-axis, you can change the formatting of the x-axis label by using the Time Label Format setting in the X tab of the visualization options. You can format time values in by using the syntax on the Time formatting for charts page.
[[["Easy to understand","easyToUnderstand","thumb-up"],["Solved my problem","solvedMyProblem","thumb-up"],["Other","otherUp","thumb-up"]],[["Hard to understand","hardToUnderstand","thumb-down"],["Incorrect information or sample code","incorrectInformationOrSampleCode","thumb-down"],["Missing the information/samples I need","missingTheInformationSamplesINeed","thumb-down"],["Other","otherDown","thumb-down"]],["Last updated 2025-08-25 UTC."],[],[],null,["# Adding custom formatting to fields\n\n| **Note:** This page is part of the [Retrieve and chart data](/looker/docs/2512/retrieve-and-chart-data) learning series.\n\u003e For Looker developers: The formatting shown on this page is the same as formatting used with the [`value_format` LookML parameter](/looker/docs/2512/reference/param-field-value-format), except that the `value_format` parameter requires the formatting string to be enclosed in double quotes.\n\nCustom formatting gives you greater control over how numeric data appears in a Looker result set. With custom formatting, you can apply Excel-style formatting options to numeric data shown in [visualizations](/looker/docs/2512/creating-visualizations), or produced by [custom fields](/looker/docs/2512/custom-fields) or [table calculations](/looker/docs/2512/table-calculations).\n| **Caution:** Custom formatting is supported only for [dimensions of `type: number`](/looker/docs/2512/reference/param-dimension-filter-parameter-types#number) or [measures of `type: number`](/looker/docs/2512/reference/param-measure-types#number). Users who do not have `develop` permissions can view a field's data type by selecting the [**Info** icon](/looker/docs/2512/creating-and-editing-explores#info_icon) next to a field's name in the Explore [field picker](/looker/docs/2512/creating-and-editing-explores#field-specific_information_and_actions).\n\nUsing custom formatting in visualizations\n-----------------------------------------\n\nFor visualizations with a **Values** tab in the gear menu:\n\n1. Select the **Edit** menu on the **Visualization** bar.\n2. Select the **Values** tab.\n3. In the **Value Format** field, enter the custom formatting string.\n\nFor example, to add custom formatting for a [table visualization](/looker/docs/2512/table-options):\n\n1. Select the **Edit** menu on the **Visualization** bar.\n2. Select the **Series** tab.\n3. In the **Customizations** section, select the **Format** drop-down and choose **Custom...**.\n\nA new blank field will appear when you select **Custom...**. Enter the custom formatting string in the blank field.\n\nUsing custom formatting with table calculations and custom fields\n-----------------------------------------------------------------\n\nWhen you create or edit a [table calculation](/looker/docs/2512/table-calculations#creating_table_calculations) or [custom field](/looker/docs/2512/custom-fields), select the **Custom** option in the **Format** drop-down and enter the custom format in the blank field.\n\nCustom formatting examples\n--------------------------\n\nYou can reference Excel's complete guide to specifying these formats [on their Number format codes documentation page](https://support.office.com/en-us/article/number-format-codes-5026bbd6-04bc-48cd-bf33-80f18b4eae68), or you can use a third-party tool to build a custom format, such as [Custom Formats Builder](https://customformats.com/).\n| **Warning:** Date formatting, color formatting, and hexadecimal conversion are not supported in Looker.\n\nSome of the most common formatting options are listed in the following table. A format code that uses `0` requires that non-significant zeros be displayed if the number contains fewer digits than specified in the code. A format code that uses `#` displays only the significant digits, even if there are fewer digits than specified in the code.\n\nSome special characters, such as international currency symbols, must be treated as strings and enclosed in double quotes.\n| **Caution:** Excel-style formatting does not support many international number formats, such as 1.234,56 or 1 234,56. Looker does support several international formats through the localization function. For information about localizing number formats, see the [Localizing number formatting](/looker/docs/2512/localizing-number-formatting) documentation page.\n\nTime formatting for charts\n--------------------------\n\nIf your chart as a time dimension on the x-axis, you can change the formatting of the x-axis label by using the **Time Label Format** setting in the **X** tab of the visualization options. You can format time values in by using the syntax on the [Time formatting for charts](/looker/docs/2512/time-formatting-for-charts) page."]]