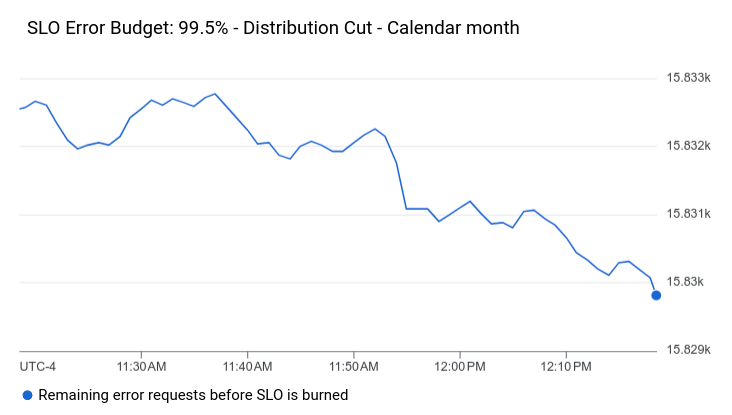
[[["易于理解","easyToUnderstand","thumb-up"],["解决了我的问题","solvedMyProblem","thumb-up"],["其他","otherUp","thumb-up"]],[["很难理解","hardToUnderstand","thumb-down"],["信息或示例代码不正确","incorrectInformationOrSampleCode","thumb-down"],["没有我需要的信息/示例","missingTheInformationSamplesINeed","thumb-down"],["翻译问题","translationIssue","thumb-down"],["其他","otherDown","thumb-down"]],["最后更新时间 (UTC):2025-07-16。"],[],[],null,["# Display SLOs on a custom dashboard\n\nTo view the health, compliance, or error budget of a service-level objective\n(SLO) for a service, add an SLO chart to a custom dashboard. An SLO chart\nprovides a summary of the performance of a service relative to a configured\nSLO. By using SLO charts, you can create a custom dashboard that shows the\nstatus of all SLOs for a set of services.\n\nBefore you can use an SLO chart, you must have services configured.\nFor information about services and SLOs, see [SLO monitoring](/stackdriver/docs/solutions/slo-monitoring).\n\nThe following screenshot illustrates an SLO chart that displays the\nerror budget for an SLO:\n\nThe remaining information in this section is for the Google Cloud console.\nFor information about using the Cloud Monitoring API, see the following\ndocuments:\n\n- [Create and manage dashboards by API](/monitoring/dashboards/api-dashboard)\n- [Dashboard with an SLO widget](/monitoring/dashboards/api-examples#dashboard_with_slo)\n\nThis feature is supported only for Google Cloud projects.\nFor [App Hub](/app-hub/docs/overview)\nconfigurations, select the App Hub host project or\nthe app-enabled folder's management project.\n\nBefore you begin\n----------------\n\nComplete the following in the Google Cloud project where you want to create and\nmodify dashboards:\n\n-\n\n To get the permissions that\n you need to create and modify custom dashboards by using the Google Cloud console,\n\n ask your administrator to grant you the\n\n\n [Monitoring Editor](/iam/docs/roles-permissions/monitoring#monitoring.editor) (`roles/monitoring.editor`)\n IAM role on your project.\n\n\n For more information about granting roles, see [Manage access to projects, folders, and organizations](/iam/docs/granting-changing-revoking-access).\n\n\n You might also be able to get\n the required permissions through [custom\n roles](/iam/docs/creating-custom-roles) or other [predefined\n roles](/iam/docs/roles-overview#predefined).\n\n For more information about roles, see\n [Control access with Identity and Access Management](/monitoring/access-control).\n- You can put up to 100 widgets on a dashboard.\n\nDisplay SLOs on a dashboard\n---------------------------\n\nTo add an SLO chart to a dashboard, do the following:\n\n1. In the Google Cloud console, go to the **Dashboards** page:\n\n [Go to **Dashboards**](https://console.cloud.google.com/monitoring/dashboards)\n\n \u003cbr /\u003e\n\n If you use the search bar to find this page, then select the result whose subheading is\n **Monitoring**.\n2. In the toolbar of the Google Cloud console, select your Google Cloud project. For [App Hub](/app-hub/docs/overview) configurations, select the App Hub host project or the app-enabled folder's management project.\n3. Select a dashboard or click **Create dashboard**.\n4. In the toolbar, click *add* **Add widget**.\n5. In the **Add widget** dialog, select **SLO**.\n6. In the **Choose an SLO to show data** pane, click *arrow_drop_down* **Service**, and then select a service.\n7. Select an existing SLO for the service from the\n **Service-level Objectives** menu.\n\n If the chosen service has no SLOs, then a message tells you that you\n must create one. To add an SLO, click **Create SLO** . For more information\n about creating SLOs, see [Creating an SLO](/stackdriver/docs/solutions/slo-monitoring/ui/create-slo).\n After you create an SLO, select it and proceed to the next step.\n8. Select an SLO metric from the **Service Level Objective Chart Type** menu.\n You can select health, compliance, and absolute or fractional error budget.\n For more information about SLO metrics, see\n [Retrieving SLO data](/stackdriver/docs/solutions/slo-monitoring/api/timeseries-selectors).\n\n9. Optional: Update the chart title.\n\n10. To apply your changes to the dashboard, in the toolbar,\n click **Apply** . To discard your changes, click **Cancel**.\n\nWhat's next\n-----------\n\nYou can also add the following widgets to your custom dashboards:\n\n- [Charts, tables, and indicators](/monitoring/charts)\n- [Log entries](/monitoring/charts/view-logs)\n- [Descriptive text](/monitoring/dashboards/text-and-grouping)\n- [Display incidents and charts for alerting policies](/monitoring/dashboards/alerts-and-incidents)\n\nFor information about exploring charted data and filtering your dashboards,\nsee the following documents:\n\n- [Explore charted data](/monitoring/charts/working-with-charts)\n- [Add temporary dashboard filters](/monitoring/charts/filter-dashboard)\n- [Create and manage variables and pinned filters](/monitoring/dashboards/filter-permanent)"]]