This document describes the widgets you can add to your custom dashboards so that you can view your log and error data in the same context as your metric data. The logs panel widget displays log entries. The error-reporting panel widget displays the most recent error groups. Both of these widgets provide information that might be helpful when troubleshooting. The Log Analytics chart widget, which displays the results of a SQL query, lets you identify trends in your log data.
This feature is supported only for Google Cloud projects. For App Hub configurations, select the App Hub host project or management project.
Logs Explorer and the logs panel widget
The Logs Explorer is the standard way to investigate logs. Adding a logs panel widget to a dashboard won't change how you use the Logs Explorer. Because logs panel widgets can be added to custom dashboards, they provide a way to view your log entries in the same context as your metrics.
The Logs Explorer and the logs panel widget support the same query language, and they both display only those log entries that you have the permission to view. Your Identity and Access Management (IAM) roles on the resources that store the log entries determine whether you can view the stored log entries.
The Logs Explorer and the logs panel widget are both preconfigured to search the resources listed in the default log scope for log entries. If that scope isn't accessible, then they search for the log entries that originate in your selected project. When a project is selected, the search results include the log entries that are routed to the project by a sink in another project and then stored in a log bucket. You can configure which resources are searched for log entries. For example, you can search for log entries by log view.
Logs panel widgets displays one log entry per row, with columns for severity, the timestamp, and a summary of the log entry. To view the JSON-formatted representation of a log entry, click the View log details button. The structure of each entry summary varies based on the log type. For example, the following picture shows two log entries:

In the previous picture, the first log entry displays information about a service request. The summary shows information about the service, an email address, and a string-formatted version of the JSON structure for the entry. The second entry displays the results of a request, and shows only a sentence summarizing the action that occurred.
For general information about Cloud Logging, see the following resources:
Before you begin
Complete the following in the Google Cloud project where you want to view logs on your custom dashboards:
-
To get the permissions that you need to add a logs panel widget to a custom dashboard by using the Google Cloud console, and to configure it to display log entries in projects or in log views, ask your administrator to grant you the following IAM roles:
-
Monitoring Editor (
roles/monitoring.editor) on on your project. -
Logging Viewer (
roles/logging.viewer) on on each project whose log entries you want to view. This role doesn't grant you access to every log entry. For more information about the roles, see Cloud Logging Access control with IAM. -
Logs View Accessor (
roles/logging.viewAccessor) on on each project that stores the log bucket for a log view that you want to access. The Logs View Accessor role grants access to all log views stored by the project. For information about how to get access to specific log views, see Control access to a log view.
For more information about granting roles, see Manage access to projects, folders, and organizations.
You might also be able to get the required permissions through custom roles or other predefined roles.
-
Monitoring Editor (
Display log entries on a dashboard
This section describes how to add and configure a logs panel widget by using
the Google Cloud console. For information about using the Cloud Monitoring API, see
Dashboard with a LogsPanel widget.
You can put up to 100 widgets on a dashboard.
To add a logs panel widget to the dashboard by using the console, do the following:
-
In the Google Cloud console, go to the
 Dashboards page:
If you use the search bar to find this page, then select the result whose subheading is Monitoring.
- In the toolbar of the Google Cloud console, select your Google Cloud project. For App Hub configurations, select the App Hub host project or management project.
- Select a dashboard or click Create dashboard.
- In the toolbar, click add Add widget.
- In the Add widget dialog, select
 Logs.
Logs. - Optional: To update the title, enter the new title in the Widget title field.
Configure which resources are searched for log entries:
To search by project, set the Scope by entry to Project, and then expand the Projects entry and complete the dialog.
The Projects menu lists all Google Cloud projects in the current metrics scope. If an entry in the menu includes the text "You don't project-level permission to view logs in this project", then you don't have the permissions required to view the log entries available in that Google Cloud project.
The displayed log entries include those that originate in your Google Cloud project and those that are routed to your Google Cloud project by a sink in another project.
To search for log entries by log views on log buckets, set the Scope by entry to Storage, and then expand the Storage views entry and complete the dialog.
The Storage views menu lists log views on log buckets in your selected Google Cloud project.
To select log views on log buckets in other Google Cloud projects, in the menu, click add_circle Import project, select a project, and then select one or more log views. You can only import projects that are included in the current metrics scope.
To search the resources included in a log scope, which can include projects and log views, set the Scope by entry to Logs Scope, and then expand the Log Scopes entry and select a log scope.
Optional: To restrict which logs the logs panel widget displays, enter a query in the Query Editor field, and if you've disabled queries from being automatically run, then click Run query. For a brief introduction to queries, see Query examples.
Optional: Apply variables to your logs panel widget.
You can update the query of a widget to depend on a variable so that when you change the value of the variable, the data displayed by widget changes. You can also use a variable to control the visibility of a widget. For more information, see the following documents:
To apply your changes to the dashboard, in the toolbar, click Apply. To discard your changes, click Cancel.
To save your modified dashboard, in the toolbar, click Save.
The logs panel widget displays a table of log entries. You can also use the widget's filter bar to temporarily change the log entries that the widget displays. For more information, see the section titled Filter the log entries.
Query examples
To populate the Query Editor field, you can enter text into the field or you can make selections from menus. The Query Editor field uses the same query language as Logs Explorer. For troubleshooting information, see Syntax issues.
The Severity and Log name menus let you select multiple options. The following is an example of a query statement that matches multiple severity levels:
severity=(WARNING OR ERROR OR CRITICAL OR ALERT OR EMERGENCY)
The Resource menu lets you filter by resource. You can select a resource type, such as Audited Resource, or you can navigate through the windows to select a specific method.
For example, to add a query for Audited Resource, do the following:
- Expand the Resource menu.
- Search for and select Audited Resource.
Click Apply.
These steps add the following clause to the Query Editor field:
resource.type="audited_resource"
Similarly, to add a query for Cloud Run functions audit logs, do the following:
- Expand the Resource menu.
- Search for and select Audited Resource.
- In the services menu, select Cloud Functions.
Click Apply.
These steps add the following clause to the Query Editor field:
resource.type="audited_resource" resource.labels.service="cloudfunctions.googleapis.com"
Filter the log entries
You can modify which log entries a logs panel widget displays by modifying the values of the following fields or menus:
Dashboard time selector: The logs panel widget only retrieves log entries that are written in the interval specified by this field.
Filter field on the logs panel widget: The filter you specify is applied after the query completes. The value of this field is retained only for the current session.
Severity menu on the logs panel widget: The filter by severity level is applied after the query completes. The value of this field is retained only for the current session.
Query on the logs panel widget: The logs panel widget displays only those log entries that match the query. If you don't specify a query, then all logs in the selected time interval are displayed. If you do specify a query, then the logs panel widget displays a Show query icon, which displays the current query as a tooltip.
To modify the query, edit the logs panel widget.
Google Cloud project on the logs panel widget: To modify this setting, edit the logs panel widget.
Dashboard filters: When dashboard filters exist, the filter setting is applied to the query of the logs panel widget. For example, if you add the dashboard filter cluster_name: mycluster, then the query is updated to include resource.labels."cluster_name"="mycluster". For more information about dashboard filters, see Add temporary filters and Add permanent filters.
The remainder of this section provides additional information about how to filter your log entries.
Example: filter log entries by date
To display the most recent logs in a logs panel widget, use the time fields in the dashboard toolbar. For example, select 1H. Provided you don't select a custom time range, the widget always displays the most recent logs, even when they are older than the selected time window.
When you are investigating an incident, you might want to restrict the log entries to those entries that are in a specific time interval. To configure the log entries to on show logs that are in a fixed time interval, do one or both of the following:
- Select a time range by using the time-range selector.
- Enter a
timestampclause in the Query Editor field of the configuration pane, and then select Apply filter.
When you specify a time interval, the logs panel widget isn't automatically refreshed.
Example: filter log entries by severity
When you are monitoring debugging a failure situation, you might only want to view error messages, and hide from the display all other logs entries. To configure a logs panel widget to display only those log entries that satisfy specific severity levels, do one or both of the following:
To apply a temporary filter, select a value for the Severity menu in the logs panel widget. This menu specifies a minimum severity level. For example, a value of "Warning" results in log entries with a severity of "Error" being retrieved, but those log entries with a severity of "Notice" aren't retrieved. By default, the value for this field is set to
Default, which includes all log entries.The setting for the Severity menu is discarded when you navigate away from the dashboard.
To apply a permanent filter, enter a
severityclause in the Query Editor field of the configuration pane, and then select Apply filter.
Example: filter log entries by a string or phrase
Filtering log entries by a specific string or phrase lets you eliminate from view log entries that aren't of interest. For example, to view log entries that include a specific email address, you can filter by that address.
To apply a temporary filter so that you view only those log entries that contain a specific word or phrase, use the filter_list Filter field. The contains-test is case insensitive.
If you add multiple filters, then only logs that match all filters are shown because an implicit
ANDis inserted between adjacent filters. However, you can explicitly insert anORoperator:For example, when you add the filters
GetandCompute, log entries that contain both words are shown.For example, when you add the filters
Get,OR, andCompute, log entries that containGetorComputeare shown.
The value of the filter_list Filter field isn't persistent.
To apply a permanent filter, modify the query stored in the Query Editor field, and then select Apply filter. For information about the query syntax, see Logging query language.
For example, to display only those log entries with a
MESSAGEfield whose value contains the string "lamp", add the clausejsonPayload.MESSAGE:"lamp"to the Query Editor field.
View log entries in the Logs Explorer
Logs panel widgets display key fields of log entries, they don't display the complete log entry. To examine all fields of a log entry, do the following:
- In the logs panel widget, select View in Logs Explorer.
In the dialog, select the Google Cloud project in which to open Logs Explorer.
Logs Explorer is opened in a new browser tab, and the filters you've selected in the logs panel widget are automatically applied.
Select the log entry that you want to view.
Display charts generated from a Log Analytics query
This section describes how to configure and save a chart generated from a Log Analytics query to a custom dashboard. Log Analytics lets you search and aggregate logs to generate useful insights by using SQL queries.
In addition to using the Log Analytics page to configure and save charts to a dashboard, you can save a Log Analytics chart directly in Monitoring by doing the following:
-
In the Google Cloud console, go to the
Dashboards page:
If you use the search bar to find this page, then select the result whose subheading is Monitoring.
- In the toolbar of the Google Cloud console, select your Google Cloud project. For App Hub configurations, select the App Hub host project or management project.
- Select a dashboard or click Create dashboard.
- In the toolbar, click add Add widget.
- In the Add widget dialog, go to the Data section, and then select Log Analytics.
In the Configure widget dialog, configure the data to display, and then click Run Query.
To select the data to display, you can build a SQL query or you can select a saved or recent query. The log views and analytics views that you can query are listed in the Views & Schema section. Clicking a data source shows a list of fields for that data source under the Schema header.
Optional: In the Results tab, customize the chart configuration by using the Display panel.
In the Display panel, you can change the chart type and customize which rows and columns are charted by changing the dimension, measure, and breakdown:
Dimension: The dimension must be a timestamp, numeric, or string column. By default, the dimension is set to the first timestamp-based column in the schema. If no timestamp is present in the query, then the first string column is selected as the dimension. You can also customize what the dimension is in the Chart display panel. When a timestamp column is selected as the dimension, then the chart shows how data changes over time. When a string column is selected as the dimension for a bar chart, you can sort the data by ascending or descending, which sorts the dimension by lexical order. You can also keep the `default` sort order, which sorts the dimension based on the values of the corresponding measure in descending order.
Measure: You can select multiple measures in the Chart display panel. When you select a measure, you must also select the aggregation function to perform on its grouped values, such as
count,sum,average, andpercentile-99. For example,count-distinctreturns the number of unique values in a given column.Breakdown: To split a single data series into multiple data series based on another column, add a breakdown.
For more information about customizing the chart configuration, see Customize chart configuration.
To save your modified dashboard, in the toolbar, click Save.
Log Analytics charts can also be edited after they are saved to a dashboard. For more information, see Modify a widget's configuration.
Display errors on a dashboard
This section describes how to add and configure an error-reporting panel by using
the Google Cloud console. For information about adding
an error-reporting panel to a dashboard by using the Cloud Monitoring API, see
Dashboard with a ErrorReportingPanel widget.
To add an error-reporting panel to the dashboard by using the console, do the following:
-
In the Google Cloud console, go to the
Dashboards page:
If you use the search bar to find this page, then select the result whose subheading is Monitoring.
- In the toolbar of the Google Cloud console, select your Google Cloud project. For App Hub configurations, select the App Hub host project or management project.
- Select a dashboard or click Create dashboard.
- In the toolbar, click add Add widget.
- In the Add widget dialog, go to the Visualization section, and then select Error Reporting panel.
- Select the project whose error groups are shown, expand arrow_drop_down Projects, and then make a selection.
- Optional: Update the title.
Optional: To restrict the resources for which errors are displayed, do the following:
- expand arrow_drop_down All Resources and select a resource.
After you select a resource, you can select Apply, or your can use the additional menus to refine the filter criteria:
To show errors for App Engine resources, select GAE Services, and then click Apply.
To show errors for a specific App Engine service, select GAE Services, select the service, and then click Apply.
To apply your changes to the dashboard, in the toolbar, click Apply. To discard your changes, click Cancel.
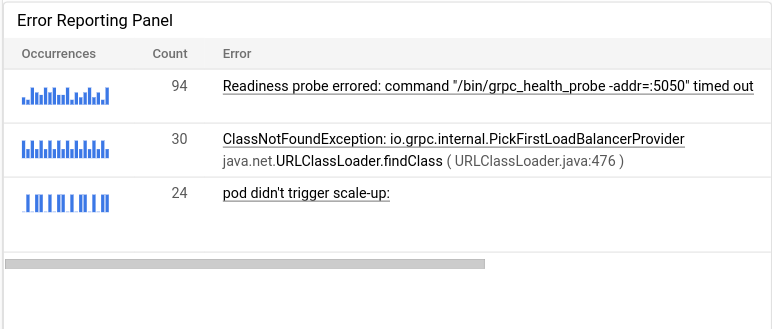
The following example shows an error-reporting panel:
To save your modified dashboard, in the toolbar, click Save.
Troubleshoot
- Logs panel indicates it displays partial data
- Logs panel reports invalid query
- Logs panel displays "No entries found" message
What's next
For information about how Cloud Monitoring provides visibility to metrics and logs stored in multiple Google Cloud projects, see Metrics scope overview.
For information about how to configure a dashboard to show logs or errors by using the API, see the following:
To learn more about error groups, see Error Reporting overview.