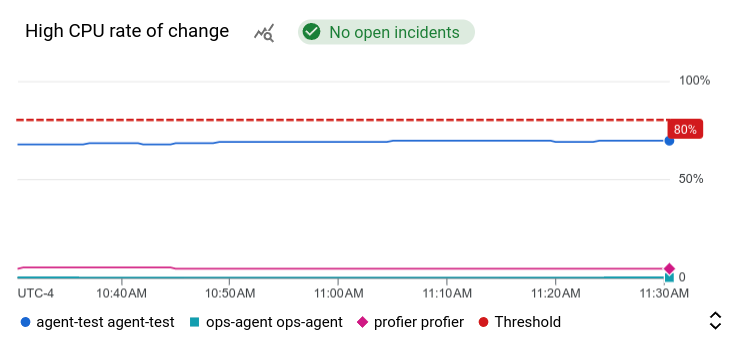
本文档介绍了如何将与提醒政策关联的图表和有关突发事件的信息添加到自定义信息中心。提醒政策的图表显示政策监控的时序、阈值、与政策关联的未结突发事件数量,以及政策是否已停用。以下屏幕截图展示了提醒政策的图表:
本文档中的信息适用于 Google Cloud 控制台。如需了解如何使用 Cloud Monitoring API,请参阅以下文档:
此功能仅适用于 Google Cloud 项目。对于 App Hub 配置,请选择 App Hub 宿主项目或已启用应用的文件夹的管理项目。
准备工作
在您要创建和管理信息中心的 Google Cloud 项目中,完成以下操作:
-
如需获得使用 Google Cloud 控制台创建和修改自定义信息中心所需的权限,请让您的管理员为您授予项目的 Monitoring Editor (
roles/monitoring.editor) IAM 角色。 如需详细了解如何授予角色,请参阅管理对项目、文件夹和组织的访问权限。如需详细了解角色,请参阅使用 Identity and Access Management 控制访问权限。
信息中心最多可容纳 100 个 widget。
向信息中心添加提醒政策
如需在信息中心内显示提醒政策的图表,请执行以下操作:
-
在 Google Cloud 控制台中,前往
 信息中心页面:
如果您使用搜索栏查找此页面,请选择子标题为监控的结果。
- 在 Google Cloud 控制台的工具栏中,选择您的 Google Cloud 项目。对于 App Hub 配置,请选择 App Hub 宿主项目或已启用应用的文件夹的管理项目。
- 选择一个信息中心或点击创建信息中心。
- 在工具栏中,点击 add 添加 widget。
- 在添加 widget 对话框中,选择
 提醒政策。
提醒政策。 - 点击 arrow_drop_down 提醒政策,然后选择一个提醒政策。
- 如需将更改应用于信息中心,请在工具栏中点击应用。如需舍弃更改,请点击取消。
查看提醒政策
当您查看提醒政策的图表时,您可能希望详细了解该提醒政策。例如,您可能希望查看选定的通知渠道或通知中包含的自定义文档。如需获取提醒政策的相关信息,请尝试以下操作:
如需访问提醒政策,请点击图表上的突发事件条状标签,然后选择查看提醒政策。
如需查看图表的详细信息,请将指针置于图表上,点击 more_vert 更多图表选项,然后选择在 Metrics Explorer 中查看。
Metrics Explorer 会显示信息中心中图表的副本。
删除提醒政策
如果您删除提醒政策,与该政策关联的所有图表都会停止显示数据。如需了解详情,请参阅提醒政策 widget 未显示任何数据。
在信息中心内显示突发事件
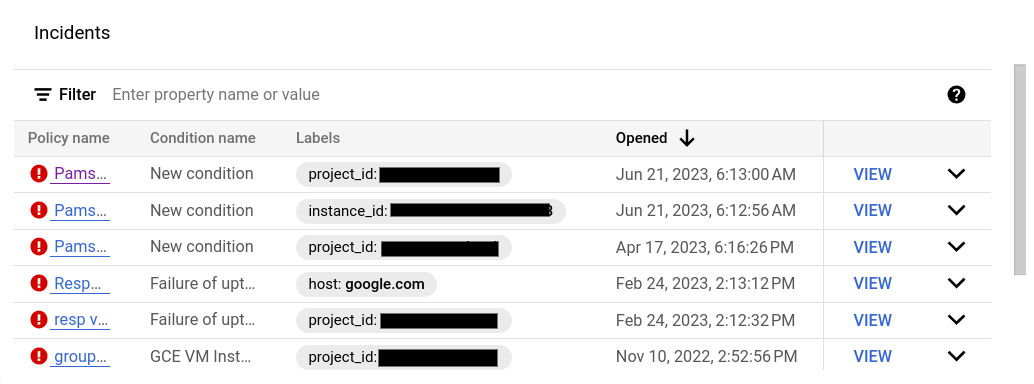
如需在与指标数据相同的上下文中查看突发事件表格,请添加突发事件 widget。突发事件表中的每一行都列出了有关一个突发事件的信息。这些信息包括政策名称、条件名称和突发事件的打开时间。该 widget 包含一些选项,可让您查看关联的提醒政策和突发事件详情。
以下屏幕截图展示了突发事件 widget:
本部分中的其余信息适用于 Google Cloud 控制台。如需了解如何使用 Cloud Monitoring API,请参阅包含 Incidents widget 的信息中心。
如需在信息中心内显示突发事件,请执行以下操作:
-
在 Google Cloud 控制台中,前往
信息中心页面:如果您使用搜索栏查找此页面,请选择子标题为监控的结果。
- 在 Google Cloud 控制台的工具栏中,选择您的 Google Cloud 项目。对于 App Hub 配置,请选择 App Hub 宿主项目或已启用应用的文件夹的管理项目。
- 选择一个信息中心或点击创建信息中心。
- 在工具栏中,点击 add 添加 widget。
- 在添加 widget 对话框中,选择
 突发事件。
突发事件。 - 可选:添加标题。
可选:选择用于定义要显示的突发事件的条件。 默认情况下,系统会列出 Google Cloud 项目中的所有突发事件。不过,您可以限制该 widget 仅显示特定提醒政策或特定资源和指标的突发事件:
如需显示所有突发事件,请使用默认设置。
如需仅显示特定提醒政策的突发事件,请选择提醒政策,然后从提醒政策菜单中进行选择。
如需仅显示特定资源类型的突发事件,请选择资源类型,然后从资源类型菜单中进行选择。
您无法选择特定的提醒政策和特定的资源类型。
如需将更改应用于信息中心,请在工具栏中点击应用。如需舍弃更改,请点击取消。
默认情况下,系统仅显示未结突发事件。如需显示所有突发事件(包括在时间范围选择器指定的计时器间隔内已关闭的突发事件),请将指针置于突发事件 widget 上以启用工具栏,然后启用 显示已关闭的突发事件切换开关。
您可以按打开或关闭日期对突发事件列表进行排序。您还可以使用 filter_list 过滤条件字段搜索列表。
查看突发事件和提醒政策的详细信息
当您查看突发事件 widget 时,您可能需要了解提醒政策或突发事件的相关信息:
如需查看与突发事件关联的提醒政策的详细信息,请在突发事件 widget 中找到该突发事件,然后选择相应政策名称。
如需查看突发事件的详细信息,请在突发事件 widget 中找到该突发事件,然后点击查看。
后续步骤
您还可以将以下 widget 添加到自定义信息中心:
如需了解如何探索绘制成图表的数据和过滤信息中心,请参阅以下文档: