Tetap teratur dengan koleksi
Simpan dan kategorikan konten berdasarkan preferensi Anda.
Membuat Tampilan dengan data contoh
Pelajari cara membuat kueri dan memvisualisasikan data di Looker serta menyimpan hasil kueri sebagai Tampilan yang dapat Anda bagikan dan gunakan kembali.
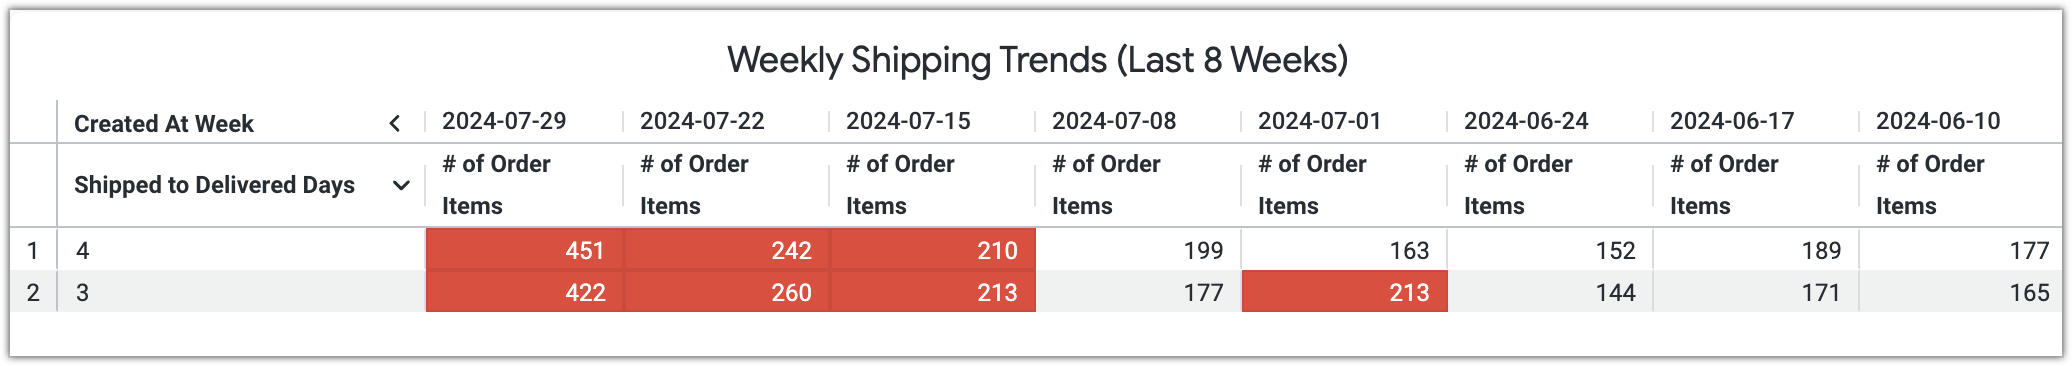
Panduan memulai ini memandu Anda dalam membuat Tampilan di instance Looker (Google Cloud core). Anda akan menggunakan contoh data dari Jelajah E-commerce Menengah bawaan untuk membuat diagram tabel berikut, lalu menyimpan diagram tersebut sebagai Tampilan.
Diagram tabel yang akan Anda buat akan menampilkan tren pengiriman mingguan, menggunakan pemformatan bersyarat (seperti latar belakang merah) untuk menyoroti potensi keterlambatan (dalam hal ini, minggu-minggu saat lebih dari 200 item pesanan memerlukan waktu lebih dari dua hari untuk dikirim). Tabel berikut adalah contoh hasil kueri yang akan Anda gunakan untuk membuat Tampilan:
Minggu Dibuat
2024-07-29
2024-07-22
2024-07-15
2024-07-08
2024-07-01
2024-06-24
2024-06-17
2024-06-10
Hari Pengiriman hingga Hari Tiba
# of Order Items
# of Order Items
# of Order Items
# of Order Items
# of Order Items
# of Order Items
# of Order Items
# of Order Items
4
451
242
210
199
163
152
189
177
3
422
260
213
177
213
144
171
165
Sebelum memulai
Untuk mengikuti panduan memulai ini, Anda memerlukan akses ke instance Looker (Google Cloud core) yang menyertakan contoh project LookML. Project contoh menyertakan Jelajah E-commerce Lanjutan bawaan yang digunakan dalam panduan memulai ini.
Anda juga harus memiliki izin Looker berikut di instance Looker (inti Google Cloud) (atau peran Looker yang menyertakan izin ini):
access_data: Mengakses data sampel di Jelajahi E-commerce Lanjutan.
explore: Mengakses halaman Jelajahi dan menjalankan kueri di Jelajahi E-commerce Lanjutan.
save_looks (dan izin induknya, save_content): Menyimpan visualisasi sebagai Tampilan.
see_looks: Melihat Tampilan yang akan Anda buat dalam panduan memulai ini.
Buka Jelajahi
Untuk membuka Jelajah E-commerce Lanjutan, ikuti langkah-langkah berikut:
Di Looker, klik Main menumenu untuk meluaskan menu navigasi utama.
Di menu navigasi utama, pilih Jelajahi.
Luaskan Z) Contoh LookML (atau nama model yang sesuai di instance Anda) untuk meluaskan daftar Jelajah.
Klik 2) E-commerce Lanjutan Eksplorasi untuk membuka halaman Eksplorasi.
Memilih kolom dan data pivot
Untuk membuat kueri, ikuti langkah-langkah berikut:
Di pemilih kolom, luaskan bagian Item Pesanan.
Di bagian Dimensi pada pemilih kolom, luaskan Tanggal Pembuatan, lalu arahkan kursor ke kolom Minggu dan pilih ikon Pivot data untuk menampilkan minggu sebagai kolom dalam tabel hasil.
Luaskan Tanggal Lainnya, lalu pilih kolom Hari Pengiriman hingga Hari Pengiriman untuk menampilkan berapa lama waktu yang dibutuhkan setiap pesanan untuk dikirim setelah dikirim.
Di bagian Measures pada pemilih kolom, pilih kolom # of Order Items untuk menampilkan jumlah total item pesanan untuk setiap kombinasi minggu dan durasi pengiriman.
Menambahkan filter dan menjalankan kueri
Selanjutnya, Anda akan menambahkan filter di kolom berikut untuk menyaring hasil kueri:
Created At Week: Filter di kolom ini akan memiliki kondisi is in the last 8 weeks, yang hanya menyertakan data dari 8 minggu terakhir.
Hari Pengiriman ke Hari Pengiriman:
Filter pertama di kolom ini akan memiliki kondisi is not null, yang mengecualikan nilai null.
Filter kedua di kolom ini akan memiliki kondisi is >2, yang hanya menyertakan durasi pengiriman yang lebih dari 2 hari.
Untuk menerapkan filter ini ke kueri Anda, ikuti langkah-langkah berikut:
Untuk setiap filter, di bagian Filter pada halaman Jelajahi, klik + Filter untuk membuka jendela Tambahkan Filter.
Di jendela Tambahkan Filter, buat setiap filter dengan memilih kondisi yang sesuai dan menambahkan nilai filter sesuai kebutuhan:
Untuk filter pertama, pilih kolom Created At Week dan pilih kondisi is in the last. Di kolom input teks, masukkan nilai 8, lalu pilih weeks dari daftar jangka waktu.
Untuk filter berikutnya, pilih kolom Hari Pengiriman ke Hari Pengiriman, lalu pilih kondisi not null.
Untuk filter terakhir, pilih kolom Hari Pengiriman hingga Hari Pengiriman. Untuk kondisi filter, pilih is >. Di kolom input teks, masukkan nilai 2.
Klik Run untuk menjalankan kueri dan menampilkan hasilnya.
Bagian Data di Jelajahi kini menampilkan jumlah item pesanan untuk setiap durasi pengiriman selama delapan minggu terakhir.
Menyesuaikan visualisasi
Sebelum menyimpan visualisasi sebagai Tampilan, ubah jenis diagram default menjadi diagram tabel dan terapkan format bersyarat untuk menyoroti potensi keterlambatan pengiriman. Untuk membuat perubahan ini, ikuti langkah-langkah berikut:
Di bagian Visualisasi pada halaman Jelajahi, klik panel Visualisasi untuk membuka editor visualisasi.
Di menu Visualisasi, pilih Tabel untuk menampilkan hasil kueri sebagai diagram tabel.
Klik Edittune untuk membuka editor visualisasi.
Di tab Series, luaskan Order Items # of Items dan nonaktifkan opsi Cell Visualization.
Di bagian Aturan pada tab Pemformatan, jika ada aturan format bersyarat yang ada, ganti kondisi default dengan kondisi berikut. Jika tidak ada aturan, klik Tambahkan Aturan untuk membuat aturan pemformatan kustom baru dan menerapkan kondisi berikut.
Di bagian Terapkan ke, pilih Pilih kolom... dan masukkan kolom Order Items # of Order Items di kolom input teks.
Di bagian Format, pilih kondisi Jika nilai lebih besar dari, lalu masukkan nilai 200.
Di bagian Gaya, pilih pilihan warna yang ada di bagian Warna latar belakang, lalu pilih warna latar belakang (dalam contoh ini, pilih warna merah).
Klik Tambahkan Aturan untuk menyimpan aturan format bersyarat.
Setelah Anda menyesuaikan visualisasi dan menerapkan pemformatan bersyarat, Looker akan menandai sel dalam diagram tabel yang berisi lebih dari 200 item pesanan yang memerlukan waktu lebih dari dua hari untuk dikirim.
Menyimpan visualisasi sebagai Look
Untuk menyimpan diagram tabel sebagai Tampilan, ikuti langkah-langkah berikut:
Klik ikon roda gigi Tindakan jelajahsettings di header Jelajah.
Pilih Simpan..., lalu pilih Sebagai Tampilan.
Di jendela Save Look, masukkan judul untuk Tampilan di kolom Title.
Di bagian Folder, pilih folder untuk menyimpan Tampilan.
Klik Save untuk menyimpan Tampilan ke folder tersebut, atau klik Save & View Look untuk menyimpan dan langsung membuka Tampilan.
Setelah menyimpan visualisasi sebagai Tampilan, Anda dapat mengaksesnya lagi untuk analisis lebih lanjut, membagikannya kepada orang lain, atau memasukkannya ke dasbor untuk visibilitas yang lebih luas. Anda juga dapat menggunakan Tampilan di dasbor, seperti yang dijelaskan dalam Membuat dasbor dengan data contoh.
[[["Mudah dipahami","easyToUnderstand","thumb-up"],["Memecahkan masalah saya","solvedMyProblem","thumb-up"],["Lainnya","otherUp","thumb-up"]],[["Sulit dipahami","hardToUnderstand","thumb-down"],["Informasi atau kode contoh salah","incorrectInformationOrSampleCode","thumb-down"],["Informasi/contoh yang saya butuhkan tidak ada","missingTheInformationSamplesINeed","thumb-down"],["Masalah terjemahan","translationIssue","thumb-down"],["Lainnya","otherDown","thumb-down"]],["Terakhir diperbarui pada 2025-08-25 UTC."],[],[],null,["# Quickstart: Build a Look with sample data\n\nBuild a Look with sample data\n=============================\n\nLearn how to query and visualize data in Looker and to save your query results as a [Look](/looker/docs/saving-and-editing-looks) that you can share and reuse.\n\nThis quickstart guides you through building a Look on your Looker (Google Cloud core) instance. You'll use sample data from the prebuilt **Intermediate Ecommerce** Explore to create the following table chart, and then you'll save the chart as a Look.\n\nThe table chart that you'll create will display weekly shipping trends, using conditional formatting (such as a red background) to highlight potential delays (in this case, weeks where more than 200 order items took over two days to be delivered). The following table is an example of the query results that you'll use to build your Look:\n\nBefore you begin\n----------------\n\nTo follow along with this quickstart, you'll need access to a Looker (Google Cloud core) instance that includes the [sample LookML project](/looker/docs/looker-core-sample-project). The sample project includes the prebuilt **Intermediate Ecommerce** Explore that is used in this quickstart.\n| **Note:** The **Intermediate Ecommerce** Explore is found in the **Z) Sample LookML** model. This model name may differ on your Looker instance.\n\nYou'll also need to have a the following [Looker permissions](/looker/docs/admin-panel-users-roles#permissions_list) on your Looker (Google Cloud core) instance (or a Looker role that includes these permissions):\n\n- `access_data`: Access the sample data in the **Intermediate Ecommerce** Explore.\n- `explore`: Access [the Explore page](/looker/docs/viewing-and-interacting-with-explores#the_explore_page) and run queries in the **Intermediate Ecommerce** Explore.\n- `save_looks` (and its parent permission, `save_content`): Save the visualization as a Look.\n- `see_looks`: View the Look that you'll create in this quickstart.\n\n| **Note:** If you plan to use this Look in a dashboard, you may also need additional permissions, such as `save_dashboards` and `see_user_dashboards`, as described in the [Build a dashboard with sample data](/looker/docs/looker-core-create-dashboard-quickstart) quickstart.\n\nNavigate to the Explore\n-----------------------\n\nTo navigate to the **Intermediate Ecommerce** Explore, follow these steps:\n\n1. In Looker, click **Main menu** menu to expand the main navigation menu.\n2. In the main navigation menu, select **Explore**.\n3. Expand **Z) Sample LookML** (or the corresponding model name on your instance) to expand the list of Explores.\n4. Click **2) Intermediate Ecommerce** Explore to open the Explore page.\n\nSelect fields and pivot data\n----------------------------\n\nTo build the query, follow these steps:\n\n1. In the field picker, expand the **Order Items** section.\n2. In the **Dimensions** section of the field picker, expand **Created At Date** , and then hold your cursor over the **Week** field and select the **Pivot data** icon to display the weeks as columns in the results table.\n3. Expand **Other Dates** , and then select the **Shipped to Delivered Days** field to show how long it took each order to be delivered after it was shipped.\n4. In the **Measures** section of the field picker, select the **# of Order Items** field to show the total number of order items for each combination of week and shipping duration.\n\nAdd filters and run the query\n-----------------------------\n\nNext, you will add filters on the following fields to refine the query results:\n\n- **Created At Week** : The filter on this field will have the condition `is in the last 8 weeks`, which includes only data from the past 8 weeks.\n- **Shipped to Delivered Days** :\n - The first filter on this field will have the condition `is not null`, which excludes null values.\n - The second filter on this field will have the condition `is \u003e2`, which includes only shipping durations that are longer than 2 days.\n\nTo apply these filters to your query, follow these steps:\n\n1. For each filter, in the **Filters** section of the Explore page, click **+ Filter** to open the **Add Filter** window.\n2. In the **Add Filter** window, create each filter by selecting the appropriate condition and adding filter values as needed:\n - For the first filter, select the **Created At Week** field and choose the **is in the last** condition. In the text input field, enter the value `8`, and select **weeks** from the list of timeframes.\n - For the next filter, select the **Shipped to Delivered Days** field and choose the **is not null** condition.\n - For the final filter, select the **Shipped to Delivered Days** field. For the filter condition, select **is \\\u003e** . In the text input field, enter the value `2`.\n3. Click **Run** to run the query and display the results.\n\nThe **Data** section of the Explore now shows the number of order items for each shipping duration over the past eight weeks.\n\nCustomize the visualization\n---------------------------\n\nBefore saving the visualization as a Look, change the default chart type to a table chart and apply conditional formatting to highlight potential shipping delays. To make these changes, follow these steps:\n\n1. In the **Visualization** section of the Explore page, click the **Visualizations** bar to open the visualization editor.\n2. In the **Visualization** menu, select **Table** to display the query results as a table chart.\n3. Click **Edit** tune to open the visualization editor.\n4. In the **Series** tab, expand **Order Items # of Items** and disable the [**Cell Visualization** option](/looker/docs/table-options#cell_visualization).\n5. In the **Formatting** tab of the visualization editor, confirm that the [**Enable conditional formatting** option](/looker/docs/table-options#enable_conditional_formatting) is enabled.\n6. In the **Rules** section of the **Formatting** tab, if there is an existing conditional formatting rule, replace the default conditions with the following conditions. If there are no rules, click **Add a Rule** to create a new custom formatting rule and apply the following conditions.\n\n - In the **Apply to** section, choose **Select fields...** and enter the **Order Items # of Order Items** field in the text input field.\n - In the **Format** section, choose the **If value is greater than** condition and enter the value `200`.\n - In the **Styles** section, select the existing color swatch in the **Background color** section, and then select a background color (in this example, select the color red).\n7. Click **Add Rule** to save the conditional formatting rule.\n\nNow that you've customized the visualization and applied conditional formatting, Looker highlights cells in the table chart where more than 200 order items took more than two days to be delivered.\n\nSave the visualization as a Look\n--------------------------------\n\nTo save the table chart as a Look, follow these steps:\n\n1. Click the **Explore actions** gear icon settings in the Explore header.\n2. Select **Save...** , and then select **As a Look**.\n3. In the **Save Look** window, enter a title for the Look in the **Title** field.\n4. In the **Folder** section, choose a folder to save the Look to.\n5. Click **Save** to save the Look to that folder, or click **Save \\& View Look** to save and immediately open the Look.\n\nNow that you've saved the visualization as a Look, you can access it again for further analysis, share it with others, or incorporate it into dashboards for broader visibility. You can also use the Look in a dashboard, as described in the [Build a dashboard with sample data](/looker/docs/looker-core-create-dashboard-quickstart).\n\nWhat's next\n-----------\n\n- [Quickstart: Build a dashboard with sample data](/looker/docs/looker-core-create-dashboard-quickstart)\n- [Creating and editing Explores](/looker/docs/creating-and-editing-explores)\n- [Filtering and limiting data](/looker/docs/filtering-and-limiting)\n- [Creating user-defined dashboards](/looker/docs/creating-user-defined-dashboards)\n- [Sharing data](/looker/docs/sharing-data)"]]
 untuk menampilkan minggu sebagai kolom dalam tabel hasil.