Benutzerdefinierte Formatierung auf Felder anwenden
Mit Sammlungen den Überblick behalten
Sie können Inhalte basierend auf Ihren Einstellungen speichern und kategorisieren.
Für Looker-Entwickler: Die Formatierung auf dieser Seite entspricht der Formatierung, die mit dem LookML-Parameter value_format verwendet wird. Der Parameter value_format erfordert jedoch, dass der Formatierungsstring in doppelten Anführungszeichen eingeschlossen wird.
Benutzerdefinierte Formatierungen ermöglichen Ihnen die Anpassung der Darstellung von numerischen Daten in einem Looker-Ergebnissatz. Mit der benutzerdefinierten Formatierung können Sie Formatierungsoptionen im Excel-Stil auf numerische Daten anwenden, die in Visualisierungen dargestellt oder von benutzerdefinierten Feldern oder Tabellenkalkulationen generiert werden.
Benutzerdefinierte Formatierung in Visualisierungen verwenden
Für Visualisierungen mit dem Tab Werte im Zahnrad-Menü:
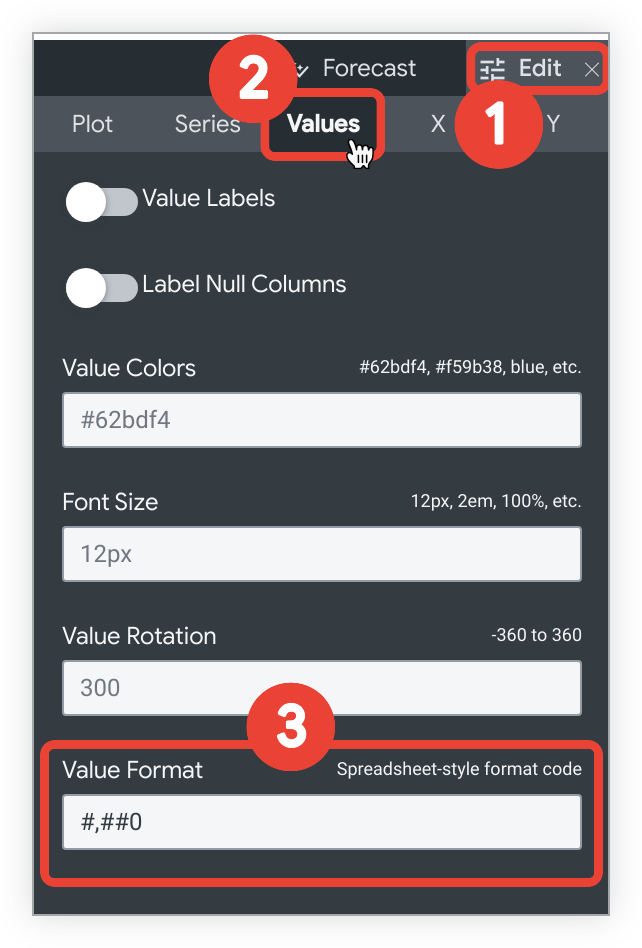
Wählen Sie in der Leiste Visualisierung das Menü Bearbeiten aus.
Wählen Sie den Tab Werte aus.
Geben Sie im Feld Wertformat die benutzerdefinierte Formatierungszeichenfolge ein.
So fügen Sie beispielsweise eine benutzerdefinierte Formatierung für eine Tabellenvisualisierung hinzu:
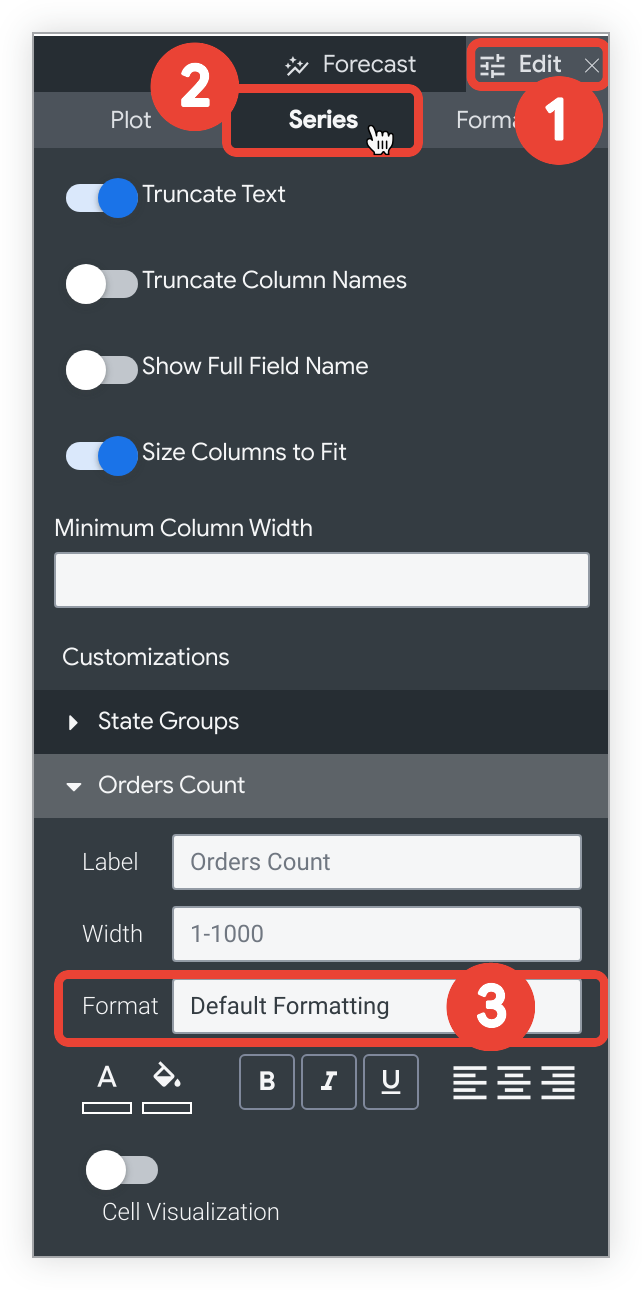
Wählen Sie in der Leiste Visualisierung das Menü Bearbeiten aus.
Wählen Sie den Tab Serien aus.
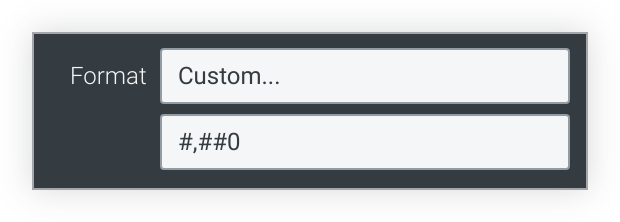
Wählen Sie im Bereich Anpassungen das Drop-down-Menü Format und dann Benutzerdefiniert… aus.
Wenn Sie Benutzerdefiniert… auswählen, wird ein neues leeres Feld angezeigt. Geben Sie die benutzerdefinierte Formatierungszeichenfolge in das leere Feld ein.
Benutzerdefinierte Formatierung in Tabellenkalkulationen und benutzerdefinierten Feldern verwenden
Wenn Sie eine Tabellenkalkulation oder ein benutzerdefiniertes Feld erstellen oder bearbeiten, wählen Sie im Drop-down-Menü Format die Option Benutzerdefiniert aus und geben Sie das benutzerdefinierte Format in das leere Feld ein.
Einige der gängigsten Formatierungsoptionen sind in der folgenden Tabelle aufgeführt. Bei der Verwendung eines Formatierungscodes mit 0 werden nicht-signifikante Nullen angezeigt, wenn die Zahl weniger Ziffern enthält als im Code angegeben. Bei einem Formatierungscode mit # werden nur die signifikanten Ziffern angezeigt, auch dann, wenn die Zahl weniger Ziffern enthält als im Code angegeben.
Einige Sonderzeichen wie internationale Währungssymbole müssen als Zeichenfolgen behandelt und in doppelte Anführungszeichen gesetzt werden.
Format
Ergebnis
0
Ganzzahl (123)
00#
Ganzzahl, mit Nullen auf 3 Stellen gefüllt (001)
0 "String"
Ganzzahl gefolgt von einem String (123 String)(„String“ kann durch einen beliebigen String ersetzt werden.)
0.##
Zahl mit bis zu 2 Dezimalstellen (1. oder 1,2 oder 1,23)
0.00
Zahl mit genau 2 Dezimalstellen (1,23)
00#.00
Ganzzahl, mit Nullen auf 3 Stellen gefüllt und genau 2 Dezimalstellen (001,23)
#,##0
Zahl mit Punkt als Tausendertrenner (1.234)
#,##0.00
Zahl mit Punkt als Tausendertrenner und 2 Dezimalstellen (1.234,00)
0.000,, "M"
Zahl in Millionen mit 3 Dezimalstellen (1.234 M)Die Division durch 1 Million erfolgt automatisch.
0.000, "K"
Zahl mit Tausendertrennzeichen und 3 Dezimalstellen (1.234 T)Die Division durch Tausend erfolgt automatisch.
$0
Dollar mit 0 Dezimalstellen (123 $)
$0.00
Dollar mit 2 Dezimalstellen (123,00 $)
"€"0
Euro mit 0 Dezimalstellen (123 €)
$#,##0.00
Dollar mit Punkt als Tausendertrenner und 2 Dezimalstellen (1.234,00 $)
$#.00;($#.00)
Dollar mit 2 Dezimalstellen, positive Werte werden normal angezeigt, negative Werte in Klammern gesetzt
0\%
Anzeige in Prozent mit 0 Dezimalstellen (1 wird zu 1 %)
0.00\%
Anzeige in Prozent mit 2 Dezimalstellen (1 wird zu 1,00 %)
0%
Umrechnung in Prozent mit 0 Dezimalstellen (,01 wird zu 1 %)
0.00%
Umrechnung in Prozent mit 2 Dezimalstellen (,01 wird zu 1,00 %)
Zeitformatierung für Diagramme
Wenn Ihr Diagramm eine Zeitdimension auf der x-Achse enthält, können Sie die Formatierung des x-Achsenlabels über die Einstellung Zeitlabelformat auf dem Tab X der Visualisierungsoptionen ändern. Sie können Zeitwerte mit der Syntax auf der Seite Zeitformatierung für Diagramme formatieren.
[[["Leicht verständlich","easyToUnderstand","thumb-up"],["Mein Problem wurde gelöst","solvedMyProblem","thumb-up"],["Sonstiges","otherUp","thumb-up"]],[["Schwer verständlich","hardToUnderstand","thumb-down"],["Informationen oder Beispielcode falsch","incorrectInformationOrSampleCode","thumb-down"],["Benötigte Informationen/Beispiele nicht gefunden","missingTheInformationSamplesINeed","thumb-down"],["Problem mit der Übersetzung","translationIssue","thumb-down"],["Sonstiges","otherDown","thumb-down"]],["Zuletzt aktualisiert: 2025-08-25 (UTC)."],[],[],null,["# Adding custom formatting to fields\n\n| **Note:** This page is part of the [Retrieve and chart data](/looker/docs/retrieve-and-chart-data) learning series.\n\u003e For Looker developers: The formatting shown on this page is the same as formatting used with the [`value_format` LookML parameter](/looker/docs/reference/param-field-value-format), except that the `value_format` parameter requires the formatting string to be enclosed in double quotes.\n\nCustom formatting gives you greater control over how numeric data appears in a Looker result set. With custom formatting, you can apply Excel-style formatting options to numeric data shown in [visualizations](/looker/docs/creating-visualizations), or produced by [custom fields](/looker/docs/custom-fields) or [table calculations](/looker/docs/table-calculations).\n| **Caution:** Custom formatting is supported only for [dimensions of `type: number`](/looker/docs/reference/param-dimension-filter-parameter-types#number) or [measures of `type: number`](/looker/docs/reference/param-measure-types#number). Users who do not have `develop` permissions can view a field's data type by selecting the [**Info** icon](/looker/docs/creating-and-editing-explores#info_icon) next to a field's name in the Explore [field picker](/looker/docs/creating-and-editing-explores#field-specific_information_and_actions).\n\nUsing custom formatting in visualizations\n-----------------------------------------\n\nFor visualizations with a **Values** tab in the gear menu:\n\n1. Select the **Edit** menu on the **Visualization** bar.\n2. Select the **Values** tab.\n3. In the **Value Format** field, enter the custom formatting string.\n\nFor example, to add custom formatting for a [table visualization](/looker/docs/table-options):\n\n1. Select the **Edit** menu on the **Visualization** bar.\n2. Select the **Series** tab.\n3. In the **Customizations** section, select the **Format** drop-down and choose **Custom...**.\n\nA new blank field will appear when you select **Custom...**. Enter the custom formatting string in the blank field.\n\nUsing custom formatting with table calculations and custom fields\n-----------------------------------------------------------------\n\nWhen you create or edit a [table calculation](/looker/docs/table-calculations#creating_table_calculations) or [custom field](/looker/docs/custom-fields), select the **Custom** option in the **Format** drop-down and enter the custom format in the blank field.\n\nCustom formatting examples\n--------------------------\n\nYou can reference Excel's complete guide to specifying these formats [on their Number format codes documentation page](https://support.office.com/en-us/article/number-format-codes-5026bbd6-04bc-48cd-bf33-80f18b4eae68), or you can use a third-party tool to build a custom format, such as [Custom Formats Builder](https://customformats.com/).\n| **Warning:** Date formatting, color formatting, and hexadecimal conversion are not supported in Looker.\n\nSome of the most common formatting options are listed in the following table. A format code that uses `0` requires that non-significant zeros be displayed if the number contains fewer digits than specified in the code. A format code that uses `#` displays only the significant digits, even if there are fewer digits than specified in the code.\n\nSome special characters, such as international currency symbols, must be treated as strings and enclosed in double quotes.\n| **Caution:** Excel-style formatting does not support many international number formats, such as 1.234,56 or 1 234,56. Looker does support several international formats through the localization function. For information about localizing number formats, see the [Localizing number formatting](/looker/docs/localizing-number-formatting) documentation page.\n\nTime formatting for charts\n--------------------------\n\nIf your chart as a time dimension on the x-axis, you can change the formatting of the x-axis label by using the **Time Label Format** setting in the **X** tab of the visualization options. You can format time values in by using the syntax on the [Time formatting for charts](/looker/docs/time-formatting-for-charts) page."]]