本页面介绍了如何使用 PromQL 代码编辑器。该编辑器在 Google Cloud 控制台中提供,并提供建议和其他工具,用于创建有效的 PromQL 查询。
本页面未介绍 PromQL 语言;如需了解 PromQL,建议您查阅开源文档。以下资源可帮助您开始使用:
访问代码编辑器
您可以通过 Google Cloud 控制台中的以下页面访问 PromQL:
- Metrics Explorer
- 创建信息中心时添加 widget
如需在使用 Metrics Explorer 时打开代码编辑器,请执行以下操作:
-
在 Google Cloud 控制台中,前往 leaderboard Metrics Explorer 页面:
如果您使用搜索栏查找此页面,请选择子标题为监控的结果。
- 在查询构建器窗格的工具栏中,选择名为 code MQL 或 code PromQL 的按钮。
- 验证已在PromQL 切换开关中选择 PromQL。语言切换开关位于同一工具栏中,用于设置查询的格式。
完成查询后,您可以配置图例或更改数据显示方式。如需了解详情,请参阅以下页面:
使用代码编辑器
如需使用代码编辑器,请在文本字段中输入查询,然后点击运行查询。
自动补全
在您输入查询时,编辑器会显示一个在语法上有效的补全列表。您可以通过按 Control+Space 手动打开自动补全菜单,也可以按 Escape 将其关闭。
要浏览选项列表,请使用箭头键。按 Enter 插入所选选项。
要插入所有可用选项通用的前缀,请按 Tab。
查找和替换
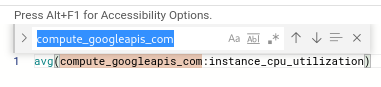
编辑器支持查找和替换功能。如需查找并选择行替换查询中的字词,请按 Control+F(或在 Mac 上按 Command+F)。以下屏幕截图展示了该功能:
编辑器控件
编辑器有两个控件,用于确定与查询的交互方式。
默认情况下,只有在点击执行查询后才会执行查询。您可以将编辑器设置为在输入时自动执行查询,但此选项默认处于停用状态。
如需启用自动运行选项,请使用自动运行切换开关。启用此选项后,编辑器的工作方式如下:
- 不显示执行查询按钮。
- 系统会在您输入时持续显示错误消息。
如果您标位于不完整但没有错误的查询的末尾,编辑器会在控制条中显示一个黄色三角形。如果有空间,还会显示查询不完整文本。
编辑器不会尝试评估不完整的查询。
代码编辑器和图表区域之间还有一个拖动条。使用此条可更改两个区域的相对大小。
保存图表
保存图表的方式取决于您创建图表的背景:
- 来自 Metrics Explorer。
- 在创建或修改自定义信息中心时。
保存 Metrics Explorer 中的图表
在 Metrics Explorer 的代码编辑器中,您可以选择将图表保存到自定义信息中心。要保存图表,请执行以下操作:
-
在 Google Cloud 控制台中,前往 leaderboard Metrics Explorer 页面:
如果您使用搜索栏查找此页面,请选择子标题为监控的结果。
- 在查询构建器窗格的工具栏中,选择名为 code MQL 或 code PromQL 的按钮。
- 验证已在PromQL 切换开关中选择 PromQL。语言切换开关位于同一工具栏中,用于设置查询的格式。
- 在编辑器中输入查询。
如果您未启用代码编辑器的自动运行选项,请在保存图表之前点击运行查询来运行查询。默认情况下,自定义信息中心会定期保存您的更改。如果您没有先运行查询,则代码编辑器会保存您最后一次运行的查询。
点击保存图表。
要继续保存图表,请执行以下操作:
- 为图表指定一个说明性标题。
- 为新图表选择信息中心。
- 点击对话框中的保存。
在自定义信息中心内保存图表
如需将新图表保存到信息中心,请执行以下操作:
为图表指定一个说明性标题。
如果您未启用代码编辑器的自动运行选项,请在保存图表之前点击运行查询来运行查询。默认情况下,自定义信息中心会定期保存您的更改。如果您没有先运行查询,则代码编辑器会保存您最后一次运行的查询。
如果您没有为信息中心启用自动保存功能,请点击保存。
Google Cloud 控制台支持自定义信息中心的页面级过滤条件。自定义信息中心内的 PromQL 图表支持这些过滤条件。
退出代码编辑器
如需退出代码编辑器而不保存查询,请点击其他选择器标签页之一。编辑器中的任何查询文本都会被舍弃,但您可以选择将其保存到剪贴板。