Mit Sammlungen den Überblick behalten
Sie können Inhalte basierend auf Ihren Einstellungen speichern und kategorisieren.
Cloud Monitoring bietet eine ausgewählte Gruppe von Dashboard-Vorlagen auf GitHub, die für eine Vielzahl von Diensten wie Compute Engine, Cloud Storage und BigQuery spezifisch sind. Google Cloud Die Diagramme auf diesen Dashboards enthalten eine Auswahl von Messwerten, die für einen bestimmten Dienst relevant sind. Sie können diese Vorlagen in Ihrem Google Cloud Projekt als benutzerdefinierte Dashboards mithilfe der Cloud Monitoring API oder der Google Cloud Console installieren.
Auf dieser Seite wird beschrieben, wie Sie eine Vorlage installieren, die in derGoogle Cloud -Konsole verfügbar ist oder im GitHub-Repository monitoring-dashboard-samples gespeichert ist.
Jede Vorlage wird als JSON-Datei gespeichert.
Auf dieser Seite wird auch beschrieben, wie Sie das Dashboard in derGoogle Cloud -Konsole aufrufen.
Diese Funktion wird nur für Google Cloud -Projekte unterstützt.
Wählen Sie für App Hub-Konfigurationen das App Hub-Hostprojekt oder das Verwaltungsprojekt des Ordners für Anwendungen aus.
Dashboard-Vorlage installieren
Google Cloud console
So installieren Sie eine Dashboard-Vorlage über die Google Cloud Console:
Rufen Sie in der Google Cloud Console die Seite Dashboards auf:
Wenn Sie diese Seite über die Suchleiste suchen, wählen Sie das Ergebnis aus, dessen Zwischenüberschrift Monitoring ist.
Wählen Sie in der Symbolleiste der Google Cloud Console Google Cloud Ihr Projekt aus. Wählen Sie für App Hub-Konfigurationen das App Hub-Hostprojekt oder das Verwaltungsprojekt des Ordners für Anwendungen aus.
Führen Sie einen der folgenden Schritte aus:
So installieren Sie eine Vorlage aus der Bibliothek, die in derGoogle Cloud -Konsole verfügbar ist:
Klicken Sie auf Dashboard-Vorlagen.
Suchen Sie das Dashboard, das Sie installieren möchten.
Optional: Wenn Sie eine Vorschau des Dashboards aufrufen möchten, wählen Sie es aus.
Klicken Sie auf playlist_addDashboard in Liste aufnehmen und füllen Sie das Dialogfeld aus.
Im Dialogfeld können Sie den Namen des Dashboards auswählen und dem Dashboard Labels hinzufügen.
So installieren Sie ein Dashboard durch Hochladen einer JSON-Datei:
Optional: Wenn Sie eine ausgewählte Dashboard-Vorlage installieren möchten, laden Sie das GitHub-Repository herunter:
Klicken Sie in der Symbolleiste des Editors auf Datei hochladen.
Wählen Sie die Datei aus, die die Vorlage enthält, und klicken Sie dann auf Öffnen.
Nachdem die Datei hochgeladen wurde, wird die JSON-Darstellung des Dashboards aktualisiert.
Wenn die folgende Meldung angezeigt wird: „Dashboard kann nicht gespeichert werden:
Feld MosaiсLayout.tiles[0] hat einen ungültigen Wert“, wählen Sie dann in der Dashboard-Symbolleiste Raster aus.
Optional: Passen Sie das Dashboard an. Sie können beispielsweise den Titel aktualisieren, ein Text-Widget hinzufügen, das die Dashboard-Quelle angibt, nicht mehr benötigte Diagramme löschen oder Diagramme hinzufügen.
Klicken Sie in der Symbolleiste auf Speichern, um das geänderte Dashboard zu speichern.
gcloud-CLI
So installieren Sie eine Dashboarddefinition mit der Google Cloud CLI:
Achten Sie darauf, dass Ihr lokales System auf die Dashboard-Definition zugreifen kann.
Bei im GitHub-Repository gespeicherten Dashboards können Sie bestimmte Dashboards speichern oder das gesamte Repository herunterladen:
Geben Sie die Dashboards an, die Sie installieren möchten.
Beispiel: Im GitHub-Repository enthält das Verzeichnis monitoring-dashboard-samples/dashboards/compute eine Datei mit dem Namen gce-vm-instance-monitoring.json.
Ersetzen Sie vor dem Ausführen des Befehls Folgendes:
PROJECT_ID: Die Kennung des Projekts. Wählen Sie für App Hub-Konfigurationen das App Hub-Hostprojekt oder das Verwaltungsprojekt des Ordners für Anwendungen aus.
Cloud Monitoring API
So installieren Sie eine Dashboarddefinition mit der Google Cloud CLI:
Achten Sie darauf, dass Ihr lokales System auf die Dashboard-Definition zugreifen kann.
Bei im GitHub-Repository gespeicherten Dashboards können Sie bestimmte Dashboards speichern oder das gesamte Repository herunterladen:
Geben Sie die Dashboards an, die Sie installieren möchten.
Beispiel: Im GitHub-Repository enthält das Verzeichnis monitoring-dashboard-samples/dashboards/compute eine Datei mit dem Namen gce-vm-instance-monitoring.json.
Rufen Sie dashboards.create auf und geben Sie die JSON-Darstellung des Dashboards an. Im API-Aufruf ist das übergeordnete Element das Projekt, in dem der synthetische Monitor erstellt werden soll.
Wählen Sie für App Hub-Konfigurationen das App Hub-Hostprojekt oder das Verwaltungsprojekt des Ordners für Anwendungen aus. Dieses Feld hat folgendes Format:
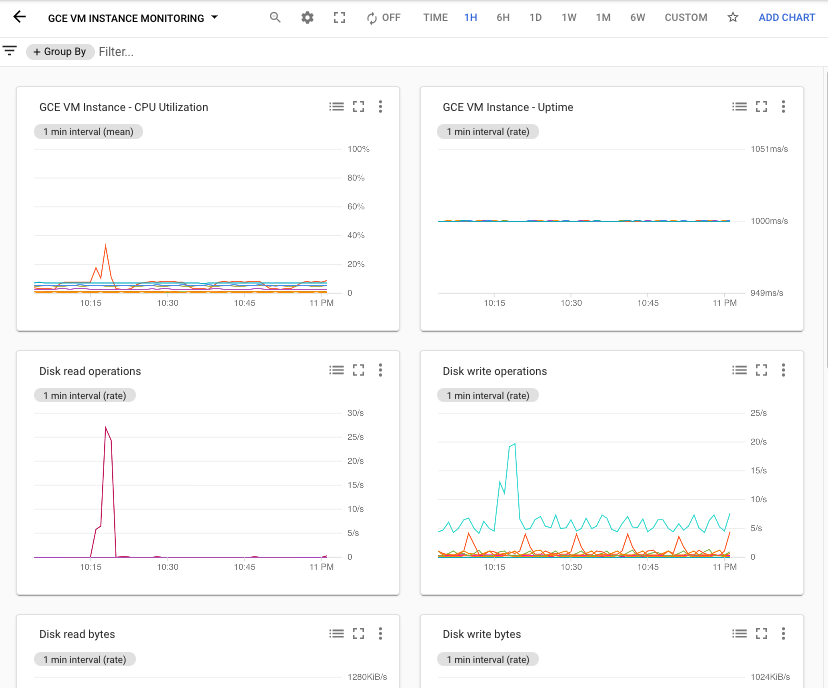
Für jede Datei im Repository wird ein neues benutzerdefiniertes Dashboard erstellt. Die Datei gce-vm-instance-monitoring.json erstellt beispielsweise ein Dashboard mit dem Titel "GCE VM Instance Monitoring". So rufen Sie dieses Dashboard auf:
Rufen Sie in der Google Cloud Console die Seite Dashboards auf:
Wenn Sie diese Seite über die Suchleiste suchen, wählen Sie das Ergebnis aus, dessen Zwischenüberschrift Monitoring ist.
Wählen Sie in der Symbolleiste der Google Cloud Console Google Cloud Ihr Projekt aus. Wählen Sie für App Hub-Konfigurationen das App Hub-Hostprojekt oder das Verwaltungsprojekt des Ordners für Anwendungen aus.
Klicken Sie in der Liste der Dashboards auf „GCE-VM-Instanzüberwachung“.
Wenn Sie viele Dashboards haben, können Sie nach benutzerdefinierten Dashboards oder nach dem Namen des neuen Dashboards filtern.
Der folgende Screenshot zeigt den Teil des installierten Dashboards:
Benutzerdefinierte Labels hinzufügen oder entfernen
Labels können Ihnen helfen, Dashboards anhand des Inhaltstyps zu finden, der darin angezeigt wird. Sie können das Label prod beispielsweise Dashboards hinzufügen, die Informationen zu Produktionssystemen enthalten. Ebenso können Sie das Label staging hinzufügen, um anzugeben, dass das Dashboard Informationen zu Staging-Systemen enthält.
Labels können nur benutzerdefinierten Dashboards hinzugefügt werden. Wenn in einem Dashboard die Schaltfläche sellLabels in Dashboard aufnehmen angezeigt wird, können Sie konfigurieren, welche Labels auf das Dashboard angewendet werden.
So fügen Sie einem benutzerdefinierten Dashboard benutzerdefinierte Labels hinzu oder entfernen sie:
Rufen Sie in der Google Cloud Console die Seite Dashboards auf:
Wenn Sie diese Seite über die Suchleiste suchen, wählen Sie das Ergebnis aus, dessen Zwischenüberschrift Monitoring ist.
Suchen Sie in der Liste der Dashboards das gewünschte Dashboard und klicken Sie dann auf sellDashboard Labels hinzufügen.
Führen Sie einen der folgenden Schritte aus:
Wenn Sie ein Label erstellen und Ihrem Dashboard hinzufügen möchten, geben Sie im Bereich Neues Label erstellen den Namen des Labels in das Textfeld ein und klicken Sie dann auf Erstellen und anwenden.
Wenn Sie konfigurieren möchten, welche Labels Ihrem Dashboard hinzugefügt werden, klicken Sie auf arrow_drop_downLabels zum Anwenden auswählen, wählen Sie die Labels aus und klicken Sie dann auf Ok.
Klicken Sie auf Bestätigen, um die Änderungen zu speichern.
[[["Leicht verständlich","easyToUnderstand","thumb-up"],["Mein Problem wurde gelöst","solvedMyProblem","thumb-up"],["Sonstiges","otherUp","thumb-up"]],[["Schwer verständlich","hardToUnderstand","thumb-down"],["Informationen oder Beispielcode falsch","incorrectInformationOrSampleCode","thumb-down"],["Benötigte Informationen/Beispiele nicht gefunden","missingTheInformationSamplesINeed","thumb-down"],["Problem mit der Übersetzung","translationIssue","thumb-down"],["Sonstiges","otherDown","thumb-down"]],["Zuletzt aktualisiert: 2025-08-28 (UTC)."],[],[],null,["# Install a dashboard template\n\nCloud Monitoring provides a curated set of dashboard templates\non GitHub that are specific to a variety of Google Cloud services, for example\nCompute Engine, Cloud Storage, BigQuery, and others. The charts\non these dashboards present a selection of metrics relevant to a specific\nservice. You can install these templates in your Google Cloud project as\ncustom\ndashboards by using the Cloud Monitoring API or by using the Google Cloud console.\n\nThis page describes how to install a template that is available from the\nGoogle Cloud console or that is stored in the\nGitHub [`monitoring-dashboard-samples` repository](https://github.com/GoogleCloudPlatform/monitoring-dashboard-samples).\nEach template is stored as a JSON file.\nThis page also describes how to view the dashboard in the\nGoogle Cloud console.\n\nThis feature is supported only for Google Cloud projects.\nFor [App Hub](/app-hub/docs/overview)\nconfigurations, select the App Hub host project or\nthe app-enabled folder's management project.\n\nInstall a dashboard template\n----------------------------\n\n**Note:** Some of the dashboards templates stored in the GitHub [`monitoring-dashboard-samples` repository](https://github.com/GoogleCloudPlatform/monitoring-dashboard-samples) display custom metric data. To install these dashboards successfully, you must create the necessary user-defined metrics. For more information, consult the per-service documentation in the repository. \n\n### Google Cloud console\n\n\nTo install a dashboard template by using the Google Cloud console,\ndo the following:\n\n1. In the Google Cloud console, go to the **Dashboards** page:\n\n [Go to **Dashboards**](https://console.cloud.google.com/monitoring/dashboards)\n\n \u003cbr /\u003e\n\n If you use the search bar to find this page, then select the result whose subheading is\n **Monitoring**.\n2. In the toolbar of the Google Cloud console,\n select your Google Cloud project. For [App Hub](/app-hub/docs/overview)\n configurations, select the App Hub host project or\n the app-enabled folder's management project.\n\n3. Do one of the following:\n\n - To install a template from the library available in the\n Google Cloud console, do the following:\n\n 1. Click **Dashboard Templates**.\n 2. Find the dashboard that you want to install.\n 3. Optional: To preview the dashboard, select it.\n 4. Click *playlist_add* **Add dashboard to your list** and\n then complete the dialog.\n\n The dialog lets you select the name of the dashboard,\n and add labels to the dashboard.\n - To install a dashboard by uploading a JSON file, do the following:\n\n 1. Optional: To install a curated dashboard template, download the\n GitHub repository:\n\n ```\n git clone https://github.com/GoogleCloudPlatform/monitoring-dashboard-samples.git\n ```\n\n \u003cbr /\u003e\n\n 2. Click **Create Dashboard**.\n\n 3. In the dashboard toolbar, *settings* **Settings** , then\n **JSON** , and then select **JSON Editor**.\n\n For a new dashboard, the displayed code is similar to the following: \n\n ```\n {\n \"displayName\": \"New Dashboard\",\n \"mosaicLayout\": {\n \"columns\": 12,\n \"tiles\": []\n },\n \"dashboardFilters\": [],\n \"labels\": {}\n }\n ```\n 4. In the editor's toolbar, click\n **File Upload**.\n\n 5. Select the file that contains the template and then\n click **Open**.\n\n After the file is uploaded, the dashboard's JSON is updated.\n\n If you see the following message, \"Unable to save dashboard:\n Field mosaicLayout.tiles\\[0\\] has an invalid value\", then select\n **Grid** in the dashboard toolbar.\n 6. Optional: Customize the dashboard. For example, you can update the\n title, add a text widget that indicates the dashboard source, delete\n unwanted charts, or add charts.\n\n 7. To save your modified dashboard, in the toolbar, click **Save**.\n\n\u003cbr /\u003e\n\n### gcloud CLI\n\n\nTo install a dashboard definition by using the Google Cloud CLI, do the\nfollowing:\n\n1. Ensure the dashboard definition is accessible to your local system.\n\n For dashboards stored in the GitHub repository, you can save specific\n dashboards, or you can download the entire repository: \n\n git clone https://github.com/GoogleCloudPlatform/monitoring-dashboard-samples.git\n\n2. Identify the dashboards you want to install.\n\n For example, in the GitHub\n repository, the directory `monitoring-dashboard-samples/dashboards/compute`\n contains a file named `gce-vm-instance-monitoring.json`.\n3. Issue the [`gcloud monitoring dashboards create`](/sdk/gcloud/reference/monitoring/dashboards/create)\n command and provide the JSON representation of the dashboard.\n\n For example, to install the dashboard `gce-vm-instance-monitoring.json`,\n issue the following command: \n\n gcloud monitoring dashboards create --config-from-file=gce-vm-instance-monitoring.json --project=\u003cvar translate=\"no\"\u003ePROJECT_ID\u003c/var\u003e\n\n Before you run the previous command, replace the following:\n - \u003cvar translate=\"no\"\u003ePROJECT_ID\u003c/var\u003e: The identifier of the project. For [App Hub](/app-hub/docs/overview) configurations, select the App Hub host project or the app-enabled folder's management project.\n\n\u003cbr /\u003e\n\n### Cloud Monitoring API\n\n\nTo install a dashboard definition by using the Google Cloud CLI, do the\nfollowing:\n\n1. Ensure the dashboard definition is accessible to your local system.\n\n For dashboards stored in the GitHub repository, you can save specific\n dashboards, or you can download the entire repository: \n\n git clone https://github.com/GoogleCloudPlatform/monitoring-dashboard-samples.git\n\n2. Identify the dashboards you want to install.\n\n For example, in the GitHub\n repository, the directory `monitoring-dashboard-samples/dashboards/compute`\n contains a file named `gce-vm-instance-monitoring.json`.\n3. Call [`dashboards.create`](/monitoring/api/ref_v3/rest/v1/projects.dashboards/create) and provide the\n JSON representation of the dashboard. In the API call, the parent is\n the project in which to create the synthetic monitor.\n For [App Hub](/app-hub/docs/overview)\n configurations, select the App Hub host project or\n the app-enabled folder's management project. This field has the following format:\n\n projects/\u003cvar translate=\"no\"\u003ePROJECT_ID\u003c/var\u003e\n\nFor more information, see\n[Create and manage dashboards](/monitoring/dashboards/api-dashboard).\n\n\u003cbr /\u003e\n\nView the installed dashboard\n----------------------------\n\nEach file in the repository creates a new custom dashboard. For example,\nthe file `gce-vm-instance-monitoring.json` creates a dashboard with the title\n\"GCE VM Instance Monitoring\". To view this dashboard, do the following:\n\n1. In the Google Cloud console, go to the **Dashboards** page:\n\n [Go to **Dashboards**](https://console.cloud.google.com/monitoring/dashboards)\n\n \u003cbr /\u003e\n\n If you use the search bar to find this page, then select the result whose subheading is\n **Monitoring**.\n2. In the toolbar of the Google Cloud console, select your Google Cloud project. For [App Hub](/app-hub/docs/overview) configurations, select the App Hub host project or the app-enabled folder's management project.\n3. In the list of dashboards, click \"GCE VM Instance Monitoring\". If you have a lot of dashboards, then you might want to filter for custom dashboards or for the name of the new dashboard.\n\nThe following screenshot shows the part of the installed dashboard:\n\nAdd or remove user-defined labels\n---------------------------------\n\nLabels can help you locate dashboards based on the type of content\nthey display. For example, you might add the label `prod` to dashboards\nthat display information about production systems. Similarly, you might\nadd the label `staging` to indicate the dashboard displays information\nabout staging systems.\n\nYou can add labels only to custom dashboards. When a dashboard displays the\nsell **Add labels to dashboard** button, then you can\nconfigure which labels are applied to the dashboard.\n\nTo add or remove user-defined labels to a custom dashboard, do the following:\n\n1. In the Google Cloud console, go to the **Dashboards** page:\n\n [Go to **Dashboards**](https://console.cloud.google.com/monitoring/dashboards)\n\n \u003cbr /\u003e\n\n If you use the search bar to find this page, then select the result whose subheading is\n **Monitoring**.\n2. In the list of dashboards, locate the dashboard and then click sell **Add labels to dashboard**.\n3. Do one of the following:\n - To create a label and add it to your dashboard,\n in the **Create a new label** section, enter the name of the label\n in the textbox and then click **Create and apply**.\n\n - To configure which labels are added to your dashboard, click *arrow_drop_down* **Select labels to apply** , select the labels, and then click **Ok**.\n4. To save your changes, click **Confirm**."]]