饼图可用于直观展示多个组成部分对整体的贡献比例。
构建饼图
忽略从可视化图表中隐藏的字段后,饼图可视化图表需要在数据部分中包含一个维度和一个测量。如果维度或指标过多,饼图将无法呈现。
饼图最多可直观呈现 50 行数据。您可以根据需要使用过滤条件或行数限制选项来限制数据。
您可以在可视化菜单中修改饼图。点击可视化图表标签页右上角的修改。

如果本帮助页面上列出的某些选项与您选择的其他设置相冲突,则这些选项可能会灰显或隐藏。
图表菜单选项
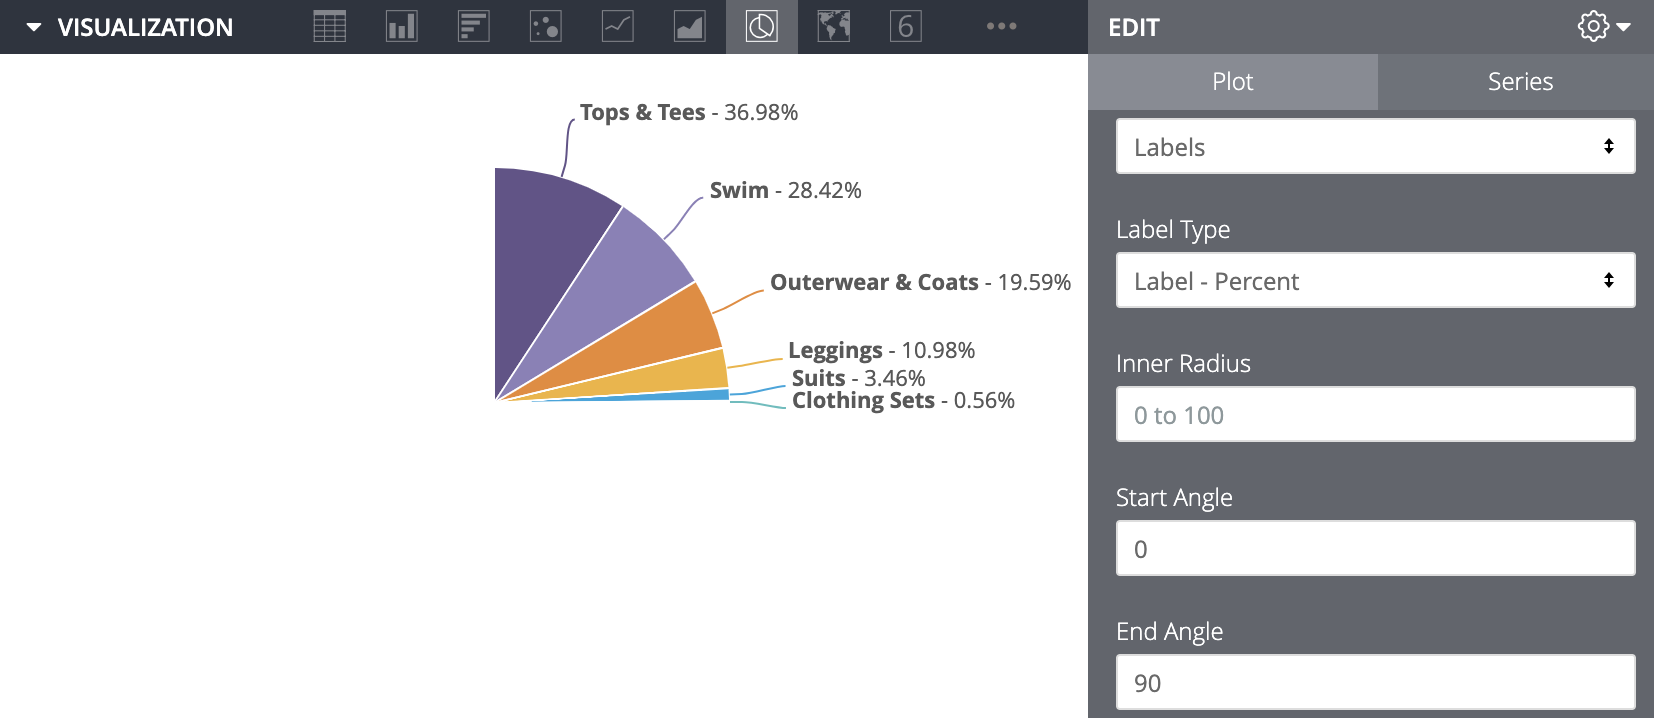
值标签
您可以更改饼图各个部分的标签显示方式:
- 无:不显示标签和图例。
- 图例:在可视化图表右侧显示图例。这是默认选项。
- 标签:显示标记饼图各个部分的线条。您可以自定义这些线条旁边显示的信息。如需了解详情,请参阅“标签类型”部分。
标签类型
当值标签设置为标签时,您可以自定义这些标签的格式:
- 标签:显示序列名称。
- 值:显示与饼图切片关联的数值。
- 标签 - 值:先以粗体显示序列名称,然后显示数值。
- 百分比:显示饼图切片占整个饼图的百分比。
- 标签 - 百分比:先以粗体显示序列名称,然后显示百分比。
内径
您可以将饼图格式设置为圆环图,方法是设置“圆环孔”的半径。此字段接受介于 0 到 100 之间的整数,表示饼图总宽度(即直径)中将构成孔的百分比。如果未设置任何值,图表将显示为普通的饼图。
起始角度和结束角度
您可以控制饼图是显示为完整的圆圈还是圆圈的一部分。这些字段使用圆的 360 度角,可以输入介于 -360 和 360 之间的数字。结束角度必须是比起始角度更大的正数;否则,可视化图表会默认显示一个完整的圆。如果未在起始角度和结束角度中输入任何值,图表也会默认显示整个圆。您的完整数据结果会显示在该圆圈的相应部分内,并会调整大小以适应该空间。
例如,如果您输入的起始角度为 0,结束角度为 90,则数据会显示在圆的右上四分之一区域内。
再举一个例子,如果您输入起始角度 -270 和结束角度 -90,则数据会显示为半圆的下半部分。

修改图表配置
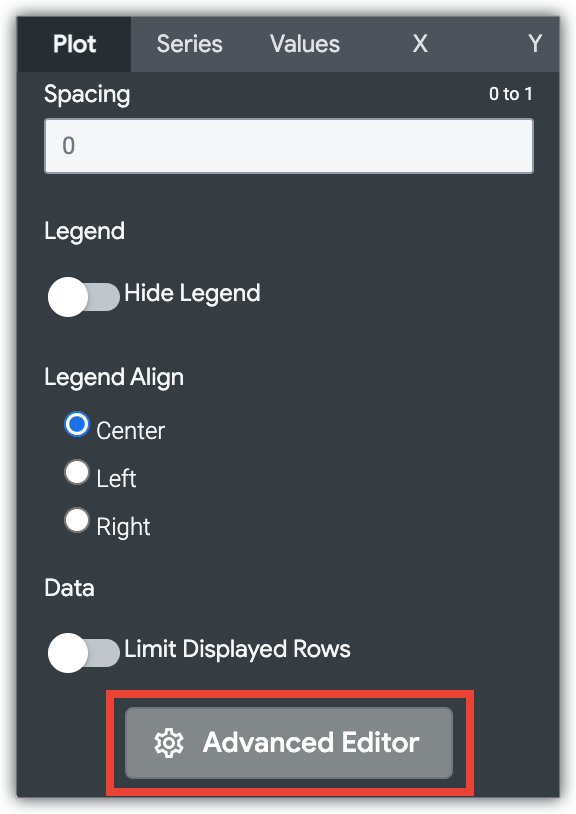
可视化菜单底部的修改图表配置按钮可打开图表配置编辑器。借助此编辑器,您可以公开可视化图表的某些 JSON 参数,从而修改 HighCharts 可视化图表,实现深度自定义。这些自定义设置不会与数据进行动态互动。
如果您拥有 Looker 管理员角色或 can_override_vis_config 权限,则可以使用修改图表配置按钮。
如需查看一些常见用例的示例,请参阅“图表配置编辑器”一文的示例部分,其中包括以下示例:
- 更改背景颜色和轴文字颜色
- 序列中值的条件格式
- 自定义提示颜色
- 添加竖向参考频段和字幕
- 添加图表注释
系列菜单选项
反转颜色
您可以反转调色板上使用的颜色。对于分类调色板,此属性会将调色板中的最后一个颜色应用于第一个序列,将调色板中的倒数第二个颜色应用于第二个序列,依此类推。对于顺序或发散调色板,此设置会将调色板最右端的颜色应用于第一个序列,并向左移动调色板以应用于其余序列。
自定义
您可以通过多种方式自定义图表中的每个序列:
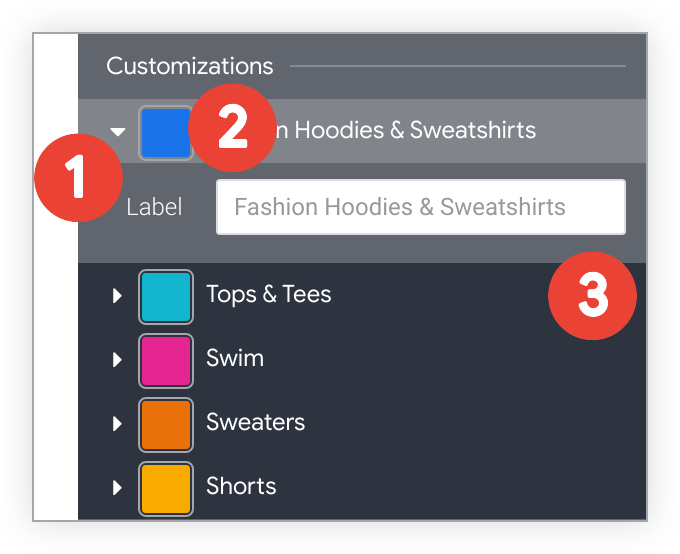
- 点击序列旁边的箭头可展开其选项。
- 点击色样,为相应序列选择自定义颜色。此属性会替换 颜色选项定义的调色板。
- 根据需要输入自定义系列标签。这会影响图表图例和提示。