Observação:
Este documento descreve a solução recomendada para coletar métricas do AWS CloudWatch e enviá-las ao Cloud Monitoring.
O uso de métricas do AWS CloudWatch em projetos do conector no Cloud Monitoring foi
descontinuado em
21 de agosto de 2023 e não é mais compatível.
Em 21 de agosto de 2024 , os projetos do AWS Connector foram desativados e a ingestão de métricas foi interrompida.
Para mais informações sobre essa alteração, consulte
Descontinuação: métricas do AWS CloudWatch em projetos do conector .
Os agentes legados do Monitoring e do Logging no Amazon Elastic Compute Cloud (Amazon EC2) ainda são compatíveis e não estão sendo descontinuados.
Neste documento, descrevemos como usar o exportador do Prometheus CloudWatch de código aberto
e o Agente de operações em execução em uma instância do Compute Engine para coletar métricas do AWS
CloudWatch e armazená-las em um projeto Google Cloud .
Este documento é destinado a desenvolvedores e administradores de sistemas que precisam coletar métricas do AWS CloudWatch. Neste documento, descrevemos como configurar o
exportador do Prometheus CloudWatch para coletar métricas do AWS CloudWatch.
Com o Cloud Monitoring, é possível ver as métricas da AWS no mesmo contexto das métricas do Google Cloud . Por exemplo, é possível criar um painel com gráficos que mostram a utilização da CPU das instâncias do Amazon EC2 e do Compute Engine. Também é possível criar políticas de alertas para monitorar suas métricas da AWS. Para saber mais, consulte as seguintes seções:
Antes de começar
Para coletar métricas do AWS CloudWatch usando o exportador do Prometheus CloudWatch, você
precisa do seguinte:
Um projeto do Google Cloud com permissões para fazer o seguinte:
Criar uma VM
Gravar registros no Cloud Logging
Gravar métricas no Cloud Monitoring
Uma conta da AWS com credenciais da AWS que podem ser usadas pelo
exportador do Prometheus para buscar métricas.
Para mais informações, consulte
Executar o exportador do Prometheus .
Criar uma VM do Compute Engine
Recomendamos criar uma VM do Linux no Compute Engine para usar especificamente
na execução do Agente de operações e do exportador do Prometheus CloudWatch. Essa VM atua como
o site de coleta de todas as métricas da AWS.
Para criar uma VM do Debian Linux chamada aws-exporter-test em uma zona especificada, execute o seguinte comando:
gcloud compute instances create \
  --image-project debian-cloud \
  --image-family debian-11 \
  --zone ZONE \
  aws-exporter-test
Configure o comando da seguinte maneira:
Substitua ZONE
Opcional. Substitua aws-exporter-test
Observação : esse comando cria uma VM com o tipo de máquina padrão
n1-standard-1. Esse tipo de máquina foi suficiente para monitorar projetos modestos em nossos testes, mas se você estiver ingerindo um grande número de métricas usando o exportador do Prometheus CloudWatch, talvez seja necessário usar uma máquina maior. Recomendamos configurar políticas de alertas sobre o uso de CPU e memória dessa VM para determinar se você precisa de uma máquina maior.
Para informações sobre políticas de alertas, consulte Criar políticas de alertas de limite de métrica . Para mais informações sobre esse comando, consulte as referências do gcloud compute instances create .
Para acessar a VM e instalar o exportador do Prometheus CloudWatch e o
Agente de operações, use o seguinte comando:
gcloud compute ssh --zone ZONE --project PROJECT_ID aws-exporter-test
Configure o comando da seguinte maneira:
Substitua ZONE pela zona em que você criou a VM.
Substitua PROJECT_ID pelo ID do seu projeto Google Cloud .
Substitua aws-exporter-test se você criou a VM com um nome diferente.
Para mais informações sobre esse comando, consulte as referências do gcloud compute ssh .
Configurar o exportador do Prometheus CloudWatch
As seções a seguir descrevem o procedimento para fazer o download, instalar e configurar o exportador do Prometheus CloudWatch na sua VM do Compute Engine.
Faça o download do exportador do Prometheus e do JRE
Para executar o exportador do Prometheus CloudWatch, faça o download dele e do Java Runtime Environment (JRE), versão 11 ou mais recente.
Para fazer o download do arquivo JAR que contém o exportador do Prometheus CloudWatch, execute o seguinte comando na sua instância do Compute Engine:
curl -sSO https://github.com/prometheus/cloudwatch_exporter/releases/download/v0.15.1/cloudwatch_exporter-0.15.1-jar-with-dependencies.jar
Para instalar o JRE, use um comando como este:
sudo apt install default-jre
Configurar o exportador do Prometheus
Para configurar o exportador do Prometheus CloudWatch, crie um arquivo de configuração para
o serviço ou serviços da AWS de que você quer coletar métricas.
Para informações gerais, consulte a documentação de configuração do exportador do Prometheus CloudWatch.
Usuários em migração : se você estiver migrando suas métricas atuais do AWS CloudWatch para o exportador do Prometheus CloudWatch, use os arquivos de configuração em Configurações do exportador do Prometheus CloudWatch para migração .
Esses arquivos de configuração foram projetados para replicar as métricas atuais da maneira mais fiel possível, mas não coletam todas as métricas disponíveis usando o exportador do Prometheus CloudWatch para os serviços da AWS.
Novos usuários : se você não estiver migrando métricas atuais, recomendamos que
não use as configurações de migração. Consulte a documentação do serviço AWS CloudWatch para saber como definir configurações de exportador para outros serviços. Você também pode
encontrar outras amostras no exportador do Prometheus CloudWatch
repositório do GitHub .
É possível combinar a configuração de vários serviços da AWS em um único arquivo de configuração. Os exemplos neste documento pressupõem que o arquivo de configuração se chama config.yml
Observação : por padrão, o exportador do Prometheus CloudWatch busca métricas com um atraso de 10 minutos. É possível mudar esse valor na configuração do exportador. Consulte
Carimbos de data/hora . O AWS CloudWatch informa métricas eventualmente consistentes, e esse atraso reduz a chance de registrar pontos de métrica que podem mudar. O Prometheus não aceita a geração de relatórios duplicados de pontos. Portanto, se você mudar esse valor e novas informações tentarem alterar pontos mais antigos, essas mudanças serão rejeitadas. Executar o exportador do Prometheus
Antes de executar o exportador do CloudWatch do Prometheus, é preciso fornecer a ele credenciais e autorização.
O exportador do Prometheus CloudWatch usa o SDK Java da AWS , que oferece maneiras de fornecer credenciais usando as seguintes variáveis de ambiente:
Para mais informações sobre como fornecer credenciais ao SDK,
consulte AWS SDK para Java 2.x .
Você também precisa ter permissão para usar a API CloudWatch e recuperar métricas. São necessárias as seguintes permissões do CloudWatch do IAM da AWS:
cloudwatch:ListMetricscloudwatch:GetMetricStatisticscloudwatch:GetMetricData
Para usar o recurso aws_tag_select, também é necessário ter a permissão tag:GetResources do IAM da AWS.
Para mais informações sobre como autorizar o acesso aos serviços da AWS, consulte
AWS Identity and Access Management .
Para executar o exportador do Prometheus CloudWatch, faça o seguinte:
Para fornecer credenciais ao exportador, defina as variáveis de ambiente de chave de acesso:
export AWS_ACCESS_KEY=YOUR_ACCESS_KEY
export AWS_SECRET_ACCESS_KEY=YOUR_SECRET_ACCESS_KEY
export AWS_SESSION_TOKEN=YOUR_SESSION_TOKEN
Substitua as variáveis YOUR_KEY pelas suas chaves de acesso.
Você só precisa definir a variável de ambiente AWS_SESSION_TOKEN se estiver usando credenciais temporárias .
Para testar sua configuração, inicie o exportador e carregue o arquivo de configuração. Execute o seguinte comando:
java -jar cloudwatch_exporter-0.15.1-jar-with-dependencies.jar 9106 config.yml Mude os valores de porta (9106 config.yml
Se você modificar o arquivo config.yml
curl -X POST localhost:9106 Para uso em um ambiente de produção, é possível configurar o exportador para
reiniciar se a VM for reiniciada. Por exemplo, em sistemas Debian, é possível usar o gerenciador de sistema e serviços, o systemd .
Configurar o agente de operações
As seções a seguir descrevem como instalar, configurar e iniciar
o agente de operações. Estas seções fornecem informações mínimas de configuração para
o Agente de operações para uso com o exportador do Prometheus CloudWatch.
Para mais informações sobre esses tópicos, consulte
Visão geral do agente de operações .
Instalar o agente de operações
Para instalar o Agente de operações, use os seguintes comandos para fazer o download e
executar o script de instalação do agente:
curl -sSO https://dl.google.com/cloudagents/add-google-cloud-ops-agent-repo.sh
sudo bash add-google-cloud-ops-agent-repo.sh --also-install
Configurar o agente de operações
Para configurar o Agente de operações, adicione elementos de configuração ao
arquivo de configuração do usuário do agente. No Linux, o arquivo de configuração do usuário
é /etc/google-cloud-ops-agent/config.yaml.
Ao configurar o Agente de operações para coletar métricas da AWS do
exportador do Prometheus CloudWatch, você usa o receptor do Prometheus do agente. Este documento descreve duas configurações básicas para o Agente de operações.
Selecione uma das configurações e adicione-a ao
arquivo de configuração do usuário:
sudo vim /etc/google-cloud-ops-agent/config.yaml
Configuração básica do Agente de operações
A configuração a seguir fornece uma configuração mínima para o
agente de operações. Essa configuração faz o seguinte:
Cria um receptor chamado aws do tipo prometheus. O receptor está
configurado para extrair métricas do job aws_exporter. A porta especificada precisa corresponder à porta em que o exportador do Prometheus CloudWatch está exportando métricas. Consulte Executar o exportador do Prometheus .
Cria um pipeline chamado aws_pipeline que usa o receptor de métricas aws.
metrics:
receivers:
aws:
type: prometheus
config:
scrape_configs:
- job_name: 'aws_exporter'
scrape_interval: 10s
static_configs:
- targets: ['localhost:9106 Configuração que descarta métricas da JVM
A configuração a seguir faz tudo o que a configuração básica faz,
mas também adiciona uma configuração de readequação de rótulos que descarta
as métricas da JVM geradas pelo exportador. A remoção dessas métricas reduz os dados de métricas ingeridos, mas pode dificultar a depuração de problemas com o exportador, porque você não recebe as métricas dele:
metrics:
receivers:
aws:
type: prometheus
config:
scrape_configs:
- job_name: 'aws_exporter'
scrape_interval: 10s
static_configs:
- targets: ['localhost:9106 É possível criar configurações muito mais complexas para o Agente de operações.
Reiniciar o agente de operações
Para aplicar as mudanças de configuração ao Agente de operações, reinicie o agente.
Para reiniciar o agente, execute o seguinte comando na instância:
sudo service google-cloud-ops-agent restart
Para confirmar se o agente foi reiniciado, execute o seguinte comando e
verifique se os componentes "Agente de métricas" e "Agente do Logging" foram iniciados:
sudo systemctl status google-cloud-ops-agent"*"
Ver métricas no Cloud Monitoring
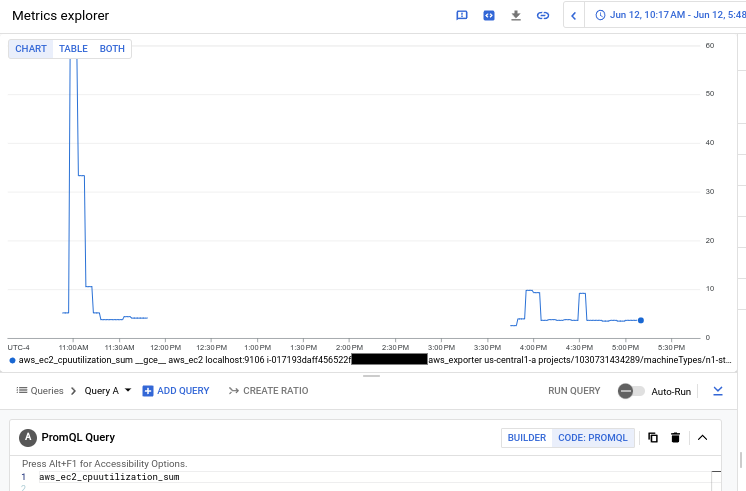
No Cloud Monitoring, é possível consultar as métricas do AWS CloudWatch e criar gráficos como faz com qualquer outra métrica. Na interface do Metrics Explorer, é possível usar o PromQL ou uma interface de criação de consultas. Para mais informações, consulte Criar gráficos com o Metrics Explorer .
Se você criou gráficos que quer manter, salve-os em painéis personalizados. Para mais informações, consulte Visão geral dos painéis .
O gráfico a seguir mostra uma consulta PromQL para a métrica
aws_ec2_cpuutilization_sum de VMs da AWS:
Para mais informações sobre como usar o PromQL no Cloud Monitoring, consulte
PromQL para Cloud Monitoring .
Alerta sobre o comportamento da métrica
No Cloud Monitoring, é possível criar políticas de alertas para monitorar as métricas do AWS CloudWatch e notificar você sobre picos, quedas ou tendências nos valores das métricas.
Monitorar várias regiões
A configuração do exportador do Prometheus CloudWatch aceita o uso de apenas uma região por arquivo de configuração. Se você precisar monitorar várias regiões, recomendamos executar várias instâncias do exportador do Prometheus, uma configurada para cada região que você quer monitorar. É possível executar vários exportadores em uma única VM ou distribuí-los em várias VMs. As imagens do Docker do exportador do Prometheus podem ser úteis nessa situação.
É possível configurar o Agente de operações em execução na VM do Compute Engine
para extrair vários endpoints do Prometheus. Recomendamos que, ao
configurar várias instâncias do exportador do Prometheus, você
use um nome job diferente para a configuração de extração de cada uma, assim
será possível distinguir as instâncias do exportador se precisar resolver problemas.
Para informações sobre como configurar o agente de operações e o receptor do Prometheus, consulte Configurar o agente de operações .
Custo
A Amazon cobra por cada solicitação da API CloudWatch ou por cada métrica do CloudWatch solicitada. Para conferir os preços atuais, consulte Preços do Amazon CloudWatch . O exportador do Prometheus CloudWatch tem as seguintes características de consulta , que podem afetar seus custos da Amazon:
Ao usar o método GetMetricStatistics (padrão), cada métrica requer uma solicitação de API. Cada solicitação pode incluir várias estatísticas.
Ao usar aws_dimensions, o exportador precisa fazer solicitações de API
para determinar quais métricas solicitar. O número de solicitações de dimensões geralmente é insignificante em comparação com o número de solicitações de métricas.
O Cloud Monitoring cobra pelas métricas do AWS CloudWatch do
exportador do Prometheus pelo número de amostras
ingeridas. Para preços atuais, consulte as seções do Cloud Monitoring na página de preços do Google Cloud Observability .
Configurações do exportador do Prometheus CloudWatch para migração
Esta seção fornece configurações que replicam, o mais próximo possível, as métricas de serviço da AWS documentadas na lista Métricas da AWS . Esses arquivos de configuração são destinados a clientes que estão migrando para o exportador do Prometheus CloudWatch da solução legada. Se você estiver configurando
o exportador do Prometheus CloudWatch como um novo usuário em vez de um usuário em migração e
usar essas configurações, não estará coletando todas as métricas da AWS
disponibilizadas pelo exportador do Prometheus CloudWatch.
Para conferir um exemplo de arquivo de configuração para métricas do AWS CloudWatch, abra uma das seções a seguir.
applicationelb.yml
region: us-east-1
metrics:
- aws_namespace: AWS/ApplicationELB
  aws_metric_name: ActiveConnectionCount
  aws_dimensions: [AvailabilityZone, LoadBalancer]
- aws_namespace: AWS/ApplicationELB
  aws_metric_name: ClientTLSNegotiationErrorCount
  aws_dimensions: [AvailabilityZone, LoadBalancer]
- aws_namespace: AWS/ApplicationELB
  aws_metric_name: ConsumedLCUs
  aws_dimensions: [LoadBalancer]
- aws_namespace: AWS/ApplicationELB
  aws_metric_name: DesyncMitigationMode_NonCompliant_Request_Count
  aws_dimensions: [AvailabilityZone, LoadBalancer]
- aws_namespace: AWS/ApplicationELB
  aws_metric_name: DroppedInvalidHeaderRequestCount
  aws_dimensions: [AvailabilityZone, LoadBalancer]
- aws_namespace: AWS/ApplicationELB
  aws_metric_name: DroppedInvalidHeaderRequestCount
  aws_dimensions: [AvailabilityZone, LoadBalancer]
- aws_namespace: AWS/ApplicationELB
  aws_metric_name: ForwardedInvalidHeaderRequestCount
  aws_dimensions: [AvailabilityZone, LoadBalancer]
- aws_namespace: AWS/ApplicationELB
  aws_metric_name: GrpcRequestCount
  aws_dimensions: [AvailabilityZone, LoadBalancer]
- aws_namespace: AWS/ApplicationELB
  aws_metric_name: HTTP_Fixed_Response_Count
  aws_dimensions: [AvailabilityZone, LoadBalancer]
- aws_namespace: AWS/ApplicationELB
  aws_metric_name: HTTP_Redirect_Count
  aws_dimensions: [AvailabilityZone, LoadBalancer]
- aws_namespace: AWS/ApplicationELB
  aws_metric_name: HTTP_Redirect_Url_Limit_Exceeded_Count
  aws_dimensions: [AvailabilityZone, LoadBalancer]
- aws_namespace: AWS/ApplicationELB
  aws_metric_name: HTTPCode_ELB_3XX_Count
  aws_dimensions: [AvailabilityZone, LoadBalancer]
- aws_namespace: AWS/ApplicationELB
  aws_metric_name: HTTPCode_ELB_4XX_Count
  aws_dimensions: [AvailabilityZone, LoadBalancer]
- aws_namespace: AWS/ApplicationELB
  aws_metric_name: HTTPCode_ELB_5XX_Count
  aws_dimensions: [AvailabilityZone, LoadBalancer]
- aws_namespace: AWS/ApplicationELB
  aws_metric_name: HTTPCode_ELB_500_Count
  aws_dimensions: [AvailabilityZone, LoadBalancer]
- aws_namespace: AWS/ApplicationELB
  aws_metric_name: HTTPCode_ELB_502_Count
  aws_dimensions: [AvailabilityZone, LoadBalancer]
- aws_namespace: AWS/ApplicationELB
  aws_metric_name: HTTPCode_ELB_503_Count
  aws_dimensions: [AvailabilityZone, LoadBalancer]
- aws_namespace: AWS/ApplicationELB
  aws_metric_name: HTTPCode_ELB_504_Count
  aws_dimensions: [AvailabilityZone, LoadBalancer]
- aws_namespace: AWS/ApplicationELB
  aws_metric_name: IPv6ProcessedBytes
  aws_dimensions: [AvailabilityZone, LoadBalancer]
- aws_namespace: AWS/ApplicationELB
  aws_metric_name: IPv6RequestCount
  aws_dimensions: [AvailabilityZone, LoadBalancer]
- aws_namespace: AWS/ApplicationELB
  aws_metric_name: NewConnectionCount
  aws_dimensions: [AvailabilityZone, LoadBalancer]
- aws_namespace: AWS/ApplicationELB
  aws_metric_name: NonStickyRequestCount
  aws_dimensions: [AvailabilityZone, LoadBalancer]
- aws_namespace: AWS/ApplicationELB
  aws_metric_name: ProcessedBytes
  aws_dimensions: [AvailabilityZone, LoadBalancer]
- aws_namespace: AWS/ApplicationELB
  aws_metric_name: RejectedConnectionCount
  aws_dimensions: [AvailabilityZone, LoadBalancer]
- aws_namespace: AWS/ApplicationELB
  aws_metric_name: RequestCount
  aws_dimensions: [AvailabilityZone, TargetGroup, LoadBalancer]
- aws_namespace: AWS/ApplicationELB
  aws_metric_name: RuleEvaluations
  aws_dimensions: [LoadBalancer]
- aws_namespace: AWS/ApplicationELB
  aws_metric_name: HealthyHostCount
  aws_dimensions: [AvailabilityZone, TargetGroup, LoadBalancer]
- aws_namespace: AWS/ApplicationELB
  aws_metric_name: HTTPCode_Target_2XX_Count
  aws_dimensions: [AvailabilityZone, TargetGroup, LoadBalancer]
- aws_namespace: AWS/ApplicationELB
  aws_metric_name: HTTPCode_Target_3XX_Count
  aws_dimensions: [AvailabilityZone, TargetGroup, LoadBalancer]
- aws_namespace: AWS/ApplicationELB
  aws_metric_name: HTTPCode_Target_4XX_Count
  aws_dimensions: [AvailabilityZone, TargetGroup, LoadBalancer]
- aws_namespace: AWS/ApplicationELB
  aws_metric_name: HTTPCode_Target_5XX_Count
  aws_dimensions: [AvailabilityZone, TargetGroup, LoadBalancer]
- aws_namespace: AWS/ApplicationELB
  aws_metric_name: RequestCountPerTarget
  aws_dimensions: [AvailabilityZone, TargetGroup, LoadBalancer]
- aws_namespace: AWS/ApplicationELB
  aws_metric_name: TargetConnectionErrorCount
  aws_dimensions: [AvailabilityZone, TargetGroup, LoadBalancer]
- aws_namespace: AWS/ApplicationELB
  aws_metric_name: TargetResponseTime
  aws_dimensions: [AvailabilityZone, TargetGroup, LoadBalancer]
- aws_namespace: AWS/ApplicationELB
  aws_metric_name: TargetTLSNegotiationErrorCount
  aws_dimensions: [AvailabilityZone, TargetGroup, LoadBalancer]
- aws_namespace: AWS/ApplicationELB
  aws_metric_name: UnHealthyHostCount
  aws_dimensions: [AvailabilityZone, TargetGroup, LoadBalancer]
- aws_namespace: AWS/ApplicationELB
  aws_metric_name: HealthyStateDNS
  aws_dimensions: [AvailabilityZone, TargetGroup, LoadBalancer]
- aws_namespace: AWS/ApplicationELB
  aws_metric_name: HealthyStateRouting
  aws_dimensions: [AvailabilityZone, TargetGroup, LoadBalancer]
- aws_namespace: AWS/ApplicationELB
  aws_metric_name: UnhealthyRoutingRequestCount
  aws_dimensions: [AvailabilityZone, TargetGroup, LoadBalancer]
- aws_namespace: AWS/ApplicationELB
  aws_metric_name: UnhealthyStateDNS
  aws_dimensions: [AvailabilityZone, TargetGroup, LoadBalancer]
- aws_namespace: AWS/ApplicationELB
  aws_metric_name: UnhealthyStateRouting
  aws_dimensions: [AvailabilityZone, TargetGroup, LoadBalancer]
- aws_namespace: AWS/ApplicationELB
  aws_metric_name: LambdaInternalError
  aws_dimensions: [TargetGroup, LoadBalancer]
- aws_namespace: AWS/ApplicationELB
  aws_metric_name: LambdaTargetProcessedBytes
  aws_dimensions: [LoadBalancer]
- aws_namespace: AWS/ApplicationELB
  aws_metric_name: LambdaUserError
  aws_dimensions: [TargetGroup, LoadBalancer]
- aws_namespace: AWS/ApplicationELB
  aws_metric_name: ELBAuthError
  aws_dimensions: [AvailabilityZone, LoadBalancer]
- aws_namespace: AWS/ApplicationELB
  aws_metric_name: ELBAuthFailure
  aws_dimensions: [AvailabilityZone, LoadBalancer]
- aws_namespace: AWS/ApplicationELB
  aws_metric_name: ELBAuthLatency
  aws_dimensions: [AvailabilityZone, LoadBalancer]
- aws_namespace: AWS/ApplicationELB
  aws_metric_name: ELBAuthRefreshTokenSuccess
  aws_dimensions: [AvailabilityZone, LoadBalancer]
- aws_namespace: AWS/ApplicationELB
  aws_metric_name: ELBAuthSuccess
  aws_dimensions: [AvailabilityZone, LoadBalancer]
- aws_namespace: AWS/ApplicationELB
  aws_metric_name: ELBAuthUserClaimsSizeExceeded
  aws_dimensions: [AvailabilityZone, LoadBalancer]
cloudfront.yml
region: us-east-1
metrics:
- aws_dimensions:
  - DistributionId
  - Region
  aws_metric_name: Requests
  aws_namespace: AWS/CloudFront
- aws_dimensions:
  - DistributionId
  - Region
  aws_metric_name: BytesDownloaded
  aws_namespace: AWS/CloudFront
- aws_dimensions:
  - DistributionId
  - Region
  aws_metric_name: BytesUploaded
  aws_namespace: AWS/CloudFront
- aws_dimensions:
  - DistributionId
  - Region
  aws_metric_name: 4xxErrorRate
  aws_namespace: AWS/CloudFront
- aws_dimensions:
  - DistributionId
  - Region
  aws_metric_name: 5xxErrorRate
  aws_namespace: AWS/CloudFront
- aws_dimensions:
  - DistributionId
  - Region
  aws_metric_name: TotalErrorRate
  aws_namespace: AWS/CloudFront
dynamodb.yml
region: us-east-1
metrics:
- aws_dimensions:
  - TableName
  - GlobalSecondaryIndexName
  aws_metric_name: ConsumedReadCapacityUnits
  aws_namespace: AWS/DynamoDB
  aws_statistics:
  - Maximum
- aws_dimensions:
  - TableName
  - GlobalSecondaryIndexName
  aws_metric_name: ConsumedWriteCapacityUnits
  aws_namespace: AWS/DynamoDB
  aws_statistics:
  - Maximum
- aws_dimensions:
  - TableName
  - Operation
  aws_metric_name: ThrottledRequests
  aws_namespace: AWS/DynamoDB
  aws_statistics:
  - Sum
- aws_dimensions:
  - TableName
  - Operation
  aws_metric_name: SystemErrors
  aws_namespace: AWS/DynamoDB
  aws_statistics:
  - Sum
- aws_dimensions:
  - TableName
  - Operation
  aws_metric_name: SuccessfulRequestLatency
  aws_namespace: AWS/DynamoDB
  aws_statistics:
  - Maximum
- aws_dimensions:
  - TableName
  - GlobalSecondaryIndexName
  aws_metric_name: WriteThrottleEvents
  aws_namespace: AWS/DynamoDB
  aws_statistics:
  - Sum
- aws_dimensions:
  - TableName
  - GlobalSecondaryIndexName
  aws_metric_name: ReadThrottleEvents
  aws_namespace: AWS/DynamoDB
  aws_statistics:
  - Sum
ebs.yml
region: us-east-1
metrics:
- aws_dimensions:
  - VolumeId
  aws_metric_name: VolumeWriteBytes
  aws_namespace: AWS/EBS
  aws_statistics:
  - Maximum
  - Average
- aws_dimensions:
  - VolumeId
  aws_metric_name: VolumeReadBytes
  aws_namespace: AWS/EBS
  aws_statistics:
  - Maximum
  - Average
- aws_dimensions:
  - VolumeId
  aws_metric_name: VolumeReadOps
  aws_namespace: AWS/EBS
  aws_statistics:
  - Average
- aws_dimensions:
  - VolumeId
  aws_metric_name: VolumeWriteOps
  aws_namespace: AWS/EBS
  aws_statistics:
  - Average
- aws_dimensions:
  - VolumeId
  aws_metric_name: VolumeTotalReadTime
  aws_namespace: AWS/EBS
  aws_statistics:
  - Sum
  - Average
- aws_dimensions:
  - VolumeId
  aws_metric_name: VolumeTotalWriteTime
  aws_namespace: AWS/EBS
  aws_statistics:
  - Sum
  - Average
- aws_dimensions:
  - VolumeId
  aws_metric_name: VolumeQueueLength
  aws_namespace: AWS/EBS
  aws_statistics:
  - Average
- aws_dimensions:
  - VolumeId
  aws_metric_name: BurstBalance
  aws_namespace: AWS/EBS
  aws_statistics:
  - Average
- aws_dimensions:
  - VolumeId
  aws_metric_name: VolumeIdleTime
  aws_namespace: AWS/EBS
  aws_statistics:
  - Sum
ec2.yml
region: us-east-1
metrics:
- aws_dimensions:
  - InstanceId
  aws_metric_name: CPUUtilization
  aws_namespace: AWS/EC2
  aws_tag_select:
    resource_type_selection: ec2:instance
    resource_id_dimension: InstanceId
- aws_dimensions:
  - InstanceId
  aws_metric_name: NetworkIn
  aws_namespace: AWS/EC2
- aws_dimensions:
  - InstanceId
  aws_metric_name: NetworkOut
  aws_namespace: AWS/EC2
- aws_dimensions:
  - InstanceId
  aws_metric_name: NetworkPacketsIn
  aws_namespace: AWS/EC2
- aws_dimensions:
  - InstanceId
  aws_metric_name: NetworkPacketsOut
  aws_namespace: AWS/EC2
- aws_dimensions:
  - InstanceId
  aws_metric_name: DiskWriteBytes
  aws_namespace: AWS/EC2
- aws_dimensions:
  - InstanceId
  aws_metric_name: DiskReadBytes
  aws_namespace: AWS/EC2
- aws_dimensions:
  - InstanceId
  aws_metric_name: CPUCreditBalance
  aws_namespace: AWS/EC2
- aws_dimensions:
  - InstanceId
  aws_metric_name: CPUCreditUsage
  aws_namespace: AWS/EC2
- aws_dimensions:
  - InstanceId
  aws_metric_name: StatusCheckFailed
  aws_namespace: AWS/EC2
- aws_dimensions:
  - InstanceId
  aws_metric_name: StatusCheckFailed_Instance
  aws_namespace: AWS/EC2
- aws_dimensions:
  - InstanceId
  aws_metric_name: StatusCheckFailed_System
  aws_namespace: AWS/EC2
elasticache.yml
region: us-east-1
metrics:
- aws_namespace: AWS/ElastiCache
  aws_metric_name: ActiveDefragHits
  aws_dimensions:
  - CacheNodeId
  - CacheClusterId
- aws_namespace: AWS/ElastiCache
  aws_metric_name: AuthenticationFailures
  aws_dimensions:
  - CacheNodeId
  - CacheClusterId
- aws_namespace: AWS/ElastiCache
  aws_metric_name: BytesReadIntoMemcached
  aws_dimensions:
  - CacheNodeId
  - CacheClusterId
- aws_namespace: AWS/ElastiCache
  aws_metric_name: BytesUsedForCache
  aws_dimensions:
  - CacheNodeId
  - CacheClusterId
- aws_namespace: AWS/ElastiCache
  aws_metric_name: BytesUsedForCacheItems
  aws_dimensions:
  - CacheNodeId
  - CacheClusterId
- aws_namespace: AWS/ElastiCache
  aws_metric_name: BytesUsedForHash
  aws_dimensions:
  - CacheNodeId
  - CacheClusterId
- aws_namespace: AWS/ElastiCache
  aws_metric_name: BytesWrittenOutFromMemcached
  aws_dimensions:
  - CacheNodeId
  - CacheClusterId
- aws_namespace: AWS/ElastiCache
  aws_metric_name: CPUCreditBalance
  aws_dimensions:
  - CacheNodeId
  - CacheClusterId
- aws_namespace: AWS/ElastiCache
  aws_metric_name: CPUCreditUsage
  aws_dimensions:
  - CacheNodeId
  - CacheClusterId
- aws_namespace: AWS/ElastiCache
  aws_metric_name: CPUUtilization
  aws_dimensions:
  - CacheNodeId
  - CacheClusterId
- aws_namespace: AWS/ElastiCache
  aws_metric_name: CacheHits
  aws_dimensions:
  - CacheNodeId
  - CacheClusterId
- aws_namespace: AWS/ElastiCache
  aws_metric_name: CacheMisses
  aws_dimensions:
  - CacheNodeId
  - CacheClusterId
- aws_namespace: AWS/ElastiCache
  aws_metric_name: CasBadval
  aws_dimensions:
  - CacheNodeId
  - CacheClusterId
- aws_namespace: AWS/ElastiCache
  aws_metric_name: CasHits
  aws_dimensions:
  - CacheNodeId
  - CacheClusterId
- aws_namespace: AWS/ElastiCache
  aws_metric_name: CasMisses
  aws_dimensions:
  - CacheNodeId
  - CacheClusterId
- aws_namespace: AWS/ElastiCache
  aws_metric_name: CmdConfigGet
  aws_dimensions:
  - CacheNodeId
  - CacheClusterId
- aws_namespace: AWS/ElastiCache
  aws_metric_name: CmdConfigSet
  aws_dimensions:
  - CacheNodeId
  - CacheClusterId
- aws_namespace: AWS/ElastiCache
  aws_metric_name: CmdFlush
  aws_dimensions:
  - CacheNodeId
  - CacheClusterId
- aws_namespace: AWS/ElastiCache
  aws_metric_name: CmdGet
  aws_dimensions:
  - CacheNodeId
  - CacheClusterId
- aws_namespace: AWS/ElastiCache
  aws_metric_name: CmdSet
  aws_dimensions:
  - CacheNodeId
  - CacheClusterId
- aws_namespace: AWS/ElastiCache
  aws_metric_name: CmdTouch
  aws_dimensions:
  - CacheNodeId
  - CacheClusterId
- aws_namespace: AWS/ElastiCache
  aws_metric_name: CommandAuthorizationFailures
  aws_dimensions:
  - CacheNodeId
  - CacheClusterId
- aws_namespace: AWS/ElastiCache
  aws_metric_name: CrawlerItemsChecked
  aws_dimensions:
  - CacheNodeId
  - CacheClusterId
- aws_namespace: AWS/ElastiCache
  aws_metric_name: CurrConfig
  aws_dimensions:
  - CacheNodeId
  - CacheClusterId
- aws_namespace: AWS/ElastiCache
  aws_metric_name: CurrConnections
  aws_dimensions:
  - CacheNodeId
  - CacheClusterId
- aws_namespace: AWS/ElastiCache
  aws_metric_name: CurrItems
  aws_dimensions:
  - CacheNodeId
  - CacheClusterId
- aws_namespace: AWS/ElastiCache
  aws_metric_name: CurrVolatileItems
  aws_dimensions:
  - CacheNodeId
  - CacheClusterId
- aws_namespace: AWS/ElastiCache
  aws_metric_name: DatabaseMemoryUsageCountedForEvictPercentage
  aws_dimensions:
  - NodeGroupId
  - ReplciationGroupId
- aws_namespace: AWS/ElastiCache
  aws_metric_name: DatabaseMemoryUsagePercentage
  aws_dimensions:
  - CacheNodeId
  - CacheClusterId
- aws_namespace: AWS/ElastiCache
  aws_metric_name: DecrHits
  aws_dimensions:
  - CacheNodeId
  - CacheClusterId
- aws_namespace: AWS/ElastiCache
  aws_metric_name: DecrMisses
  aws_dimensions:
  - CacheNodeId
  - CacheClusterId
- aws_namespace: AWS/ElastiCache
  aws_metric_name: DeleteHits
  aws_dimensions:
  - CacheNodeId
  - CacheClusterId
- aws_namespace: AWS/ElastiCache
  aws_metric_name: DeleteMisses
  aws_dimensions:
  - CacheNodeId
  - CacheClusterId
- aws_namespace: AWS/ElastiCache
  aws_metric_name: EngineCPUUtilization
  aws_dimensions:
  - CacheNodeId
  - CacheClusterId
  - NodeGroupId
  - ReplicationGroupId
  - Role
- aws_namespace: AWS/ElastiCache
  aws_metric_name: EvictedUnfetched
  aws_dimensions:
  - CacheNodeId
  - CacheClusterId
- aws_namespace: AWS/ElastiCache
  aws_metric_name: Evictions
  aws_dimensions:
  - CacheNodeId
  - CacheClusterId
- aws_namespace: AWS/ElastiCache
  aws_metric_name: ExpiredUnfetched
  aws_dimensions:
  - CacheNodeId
  - CacheClusterId
- aws_namespace: AWS/ElastiCache
  aws_metric_name: FreeableMemory
  aws_dimensions:
  - CacheNodeId
  - CacheClusterId
- aws_namespace: AWS/ElastiCache
  aws_metric_name: GetHits
  aws_dimensions:
  - CacheNodeId
  - CacheClusterId
- aws_namespace: AWS/ElastiCache
  aws_metric_name: GetMisses
  aws_dimensions:
  - CacheNodeId
  - CacheClusterId
- aws_namespace: AWS/ElastiCache
  aws_metric_name: IamAuthenticationExpirations
  aws_dimensions:
  - CacheNodeId
  - CacheClusterId
- aws_namespace: AWS/ElastiCache
  aws_metric_name: IamAuthenticationThrottling
  aws_dimensions:
  - CacheNodeId
  - CacheClusterId
- aws_namespace: AWS/ElastiCache
  aws_metric_name: IncrHits
  aws_dimensions:
  - CacheNodeId
  - CacheClusterId
- aws_namespace: AWS/ElastiCache
  aws_metric_name: IncrMisses
  aws_dimensions:
  - CacheNodeId
  - CacheClusterId
- aws_namespace: AWS/ElastiCache
  aws_metric_name: IsMaster
  aws_dimensions:
  - CacheNodeId
  - CacheClusterId
- aws_namespace: AWS/ElastiCache
  aws_metric_name: KeyAuthorizationFailures
  aws_dimensions:
  - CacheNodeId
  - CacheClusterId
- aws_namespace: AWS/ElastiCache
  aws_metric_name: KeyBasedCmds
  aws_dimensions:
  - CacheNodeId
  - CacheClusterId
- aws_namespace: AWS/ElastiCache
  aws_metric_name: ListBasedCmds
  aws_dimensions:
  - CacheNodeId
  - CacheClusterId
- aws_namespace: AWS/ElastiCache
  aws_metric_name: KeysTracked
  aws_dimensions:
  - CacheNodeId
  - CacheClusterId
- aws_namespace: AWS/ElastiCache
  aws_metric_name: MasterLinkHealthStatus
  aws_dimensions:
  - CacheNodeId
  - CacheClusterId
- aws_namespace: AWS/ElastiCache
  aws_metric_name: MemoryFragmentationRatio
  aws_dimensions:
  - CacheNodeId
  - CacheClusterId
- aws_namespace: AWS/ElastiCache
  aws_metric_name: NetworkBandwidthInAllowanceExceeded
  aws_dimensions:
  - CacheNodeId
  - CacheClusterId
- aws_namespace: AWS/ElastiCache
  aws_metric_name: NetworkBandwidthOutAllowanceExceeded
  aws_dimensions:
  - CacheNodeId
  - CacheClusterId
- aws_namespace: AWS/ElastiCache
  aws_metric_name: NetworkBytesIn
  aws_dimensions:
  - CacheNodeId
  - CacheClusterId
- aws_namespace: AWS/ElastiCache
  aws_metric_name: NetworkBytesOut
  aws_dimensions:
  - CacheNodeId
  - CacheClusterId
- aws_namespace: AWS/ElastiCache
  aws_metric_name: NetworkConntrackAllowanceExceeded
  aws_dimensions:
  - CacheNodeId
  - CacheClusterId
- aws_namespace: AWS/ElastiCache
  aws_metric_name: NetworkPacketsIn
  aws_dimensions:
  - CacheNodeId
  - CacheClusterId
- aws_namespace: AWS/ElastiCache
  aws_metric_name: NetworkPacketsOut
  aws_dimensions:
  - CacheNodeId
  - CacheClusterId
- aws_namespace: AWS/ElastiCache
  aws_metric_name: NetworkPacketsPerSecondAllowanceExceeded
  aws_dimensions:
  - CacheNodeId
  - CacheClusterId
- aws_namespace: AWS/ElastiCache
  aws_metric_name: NewConnections
  aws_dimensions:
  - CacheNodeId
  - CacheClusterId
- aws_namespace: AWS/ElastiCache
  aws_metric_name: NewItems
  aws_dimensions:
  - CacheNodeId
  - CacheClusterId
- aws_namespace: AWS/ElastiCache
  aws_metric_name: NonKeyTypeCmds
  aws_dimensions:
  - CacheNodeId
  - CacheClusterId
- aws_namespace: AWS/ElastiCache
  aws_metric_name: NonKeyTypeCmdsLatency
  aws_dimensions:
  - CacheNodeId
  - CacheClusterId
- aws_namespace: AWS/ElastiCache
  aws_metric_name: Reclaimed
  aws_dimensions:
  - CacheNodeId
  - CacheClusterId
- aws_namespace: AWS/ElastiCache
  aws_metric_name: ReplicationBytes
  aws_dimensions:
  - CacheNodeId
  - CacheClusterId
- aws_namespace: AWS/ElastiCache
  aws_metric_name: ReplicationLag
  aws_dimensions:
  - CacheNodeId
  - CacheClusterId
- aws_namespace: AWS/ElastiCache
  aws_metric_name: SetBasedCmds
  aws_dimensions:
  - CacheNodeId
  - CacheClusterId
- aws_namespace: AWS/ElastiCache
  aws_metric_name: SetTypeCmds
  aws_dimensions:
  - CacheNodeId
  - CacheClusterId
- aws_namespace: AWS/ElastiCache
  aws_metric_name: SlabsMoved
  aws_dimensions:
  - CacheNodeId
  - CacheClusterId
- aws_namespace: AWS/ElastiCache
  aws_metric_name: SortedSetBasedCmds
  aws_dimensions:
  - CacheNodeId
  - CacheClusterId
- aws_namespace: AWS/ElastiCache
  aws_metric_name: StringBasedCmds
  aws_dimensions:
  - CacheNodeId
  - CacheClusterId
- aws_namespace: AWS/ElastiCache
  aws_metric_name: SaveInProgress
  aws_dimensions:
  - CacheNodeId
  - CacheClusterId
- aws_namespace: AWS/ElastiCache
  aws_metric_name: SwapUsage
  aws_dimensions:
  - CacheNodeId
  - CacheClusterId
- aws_namespace: AWS/ElastiCache
  aws_metric_name: TouchHits
  aws_dimensions:
  - CacheNodeId
  - CacheClusterId
- aws_namespace: AWS/ElastiCache
  aws_metric_name: TouchMisses
  aws_dimensions:
  - CacheNodeId
  - CacheClusterId
- aws_namespace: AWS/ElastiCache
  aws_metric_name: TrafficManagementActive
  aws_dimensions:
  - CacheNodeId
  - CacheClusterId
- aws_namespace: AWS/ElastiCache
  aws_metric_name: UnusedMemory
  aws_dimensions:
  - CacheNodeId
  - CacheClusterId
elb.yml
region: us-east-1
metrics:
- aws_dimensions:
  - AvailabilityZone
  aws_metric_name: BackendConnectionErrors
  aws_namespace: AWS/ELB
- aws_dimensions:
  - AvailabilityZone
  aws_metric_name: HTTPCode_Backend_5XX
  aws_namespace: AWS/ELB
- aws_dimensions:
  - AvailabilityZone
  aws_metric_name: HTTPCode_Backend_4XX
  aws_namespace: AWS/ELB
- aws_dimensions:
  - AvailabilityZone
  aws_metric_name: HTTPCode_Backend_3XX
  aws_namespace: AWS/ELB
- aws_dimensions:
  - AvailabilityZone
  aws_metric_name: HTTPCode_Backend_2XX
  aws_namespace: AWS/ELB
- aws_dimensions:
  - AvailabilityZone
  aws_metric_name: HTTPCode_ELB_5XX
  aws_namespace: AWS/ELB
- aws_dimensions:
  - AvailabilityZone
  aws_metric_name: RequestCount
  aws_namespace: AWS/ELB
- aws_dimensions:
  - AvailabilityZone
  aws_metric_name: HTTPCode_ELB_4XX
  aws_namespace: AWS/ELB
- aws_dimensions:
  - AvailabilityZone
  aws_metric_name: Latency
  aws_namespace: AWS/ELB
- aws_dimensions:
  - AvailabilityZone
  aws_metric_name: SurgeQueueLength
  aws_namespace: AWS/ELB
- aws_dimensions:
  - AvailabilityZone
  aws_metric_name: ActiveFlowCount
  aws_namespace: AWS/ELB
- aws_dimensions:
  - AvailabilityZone
  aws_metric_name: ActiveFlowCount_TLS
  aws_namespace: AWS/ELB
- aws_dimensions:
  - AvailabilityZone
  aws_metric_name: ProcessedBytes
  aws_namespace: AWS/ELB
- aws_dimensions:
  - AvailabilityZone
  aws_metric_name: ProcessedBytes_TLS
  aws_namespace: AWS/ELB
- aws_dimensions:
  - AvailabilityZone
  aws_metric_name: HealthyHostCount
  aws_namespace: AWS/ELB
- aws_dimensions:
  - AvailabilityZone
  aws_metric_name: UnHealthyHostCount
  aws_namespace: AWS/ELB
- aws_dimensions:
  - AvailabilityZone
  aws_metric_name: NewFlowCount
  aws_namespace: AWS/ELB
- aws_dimensions:
  - AvailabilityZone
  aws_metric_name: NewFlowCount_TLS
  aws_namespace: AWS/ELB
- aws_dimensions:
  - AvailabilityZone
  aws_metric_name: TCP_Client_Reset_Count
  aws_namespace: AWS/ELB
- aws_dimensions:
  - AvailabilityZone
  aws_metric_name: TCP_Target_Reset_Count
  aws_namespace: AWS/ELB
- aws_dimensions:
  - AvailabilityZone
  aws_metric_name: TCP_ELB_Reset_Count
  aws_namespace: AWS/ELB
- aws_dimensions:
  - AvailabilityZone
  aws_metric_name: ClientTLSNegotiationErrorCount
  aws_namespace: AWS/ELB
- aws_dimensions:
  - AvailabilityZone
  aws_metric_name: TargetTLSNegotiationErrorCount
  aws_namespace: AWS/ELB
- aws_dimensions:
  - AvailabilityZone
  aws_metric_name: ConsumedLCUs
  aws_namespace: AWS/ELB
- aws_dimensions:
  - AvailabilityZone
  aws_metric_name: SpilloverCount
  aws_namespace: AWS/ELB
kinesis.yml
region: us-east-2
metrics:
- aws_dimensions:
  - StreamName
  aws_metric_name: IncomingBytes
  aws_namespace: AWS/Kinesis
- aws_dimensions:
  - StreamName
  aws_metric_name: PutRecord.Bytes
  aws_namespace: AWS/Kinesis
- aws_dimensions:
  - StreamName
  aws_metric_name: PutRecords.Bytes
  aws_namespace: AWS/Kinesis
- aws_dimensions:
  - StreamName
  aws_metric_name: GetRecords.Latency
  aws_namespace: AWS/Kinesis
- aws_dimensions:
  - StreamName
  aws_metric_name: PutRecord.Success
  aws_namespace: AWS/Kinesis
- aws_dimensions:
  - StreamName
  aws_metric_name: PutRecords.Success
  aws_namespace: AWS/Kinesis
- aws_dimensions:
  - StreamName
  aws_metric_name: GetRecords.Latency
  aws_namespace: AWS/Kinesis
- aws_dimensions:
  - StreamName
  aws_metric_name: PutRecord.Latency
  aws_namespace: AWS/Kinesis
- aws_dimensions:
  - StreamName
  aws_metric_name: PutRecords.Latency
  aws_namespace: AWS/Kinesis
- aws_dimensions:
  - StreamName
  aws_metric_name: GetRecords.Latency
  aws_namespace: AWS/Kinesis
- aws_dimensions:
  - StreamName
  aws_metric_name: GetRecords.Records
  aws_namespace: AWS/Kinesis
- aws_dimensions:
  - StreamName
  aws_metric_name: GetRecords.Bytes
  aws_namespace: AWS/Kinesis
- aws_dimensions:
  - StreamName
  aws_metric_name: GetRecords.Success
  aws_namespace: AWS/Kinesis
- aws_dimensions:
  - StreamName
  aws_metric_name: GetRecords.IteratorAgeMilliseconds
  aws_namespace: AWS/Kinesis
- aws_dimensions:
  - StreamName
  aws_metric_name: IncomingRecords
  aws_namespace: AWS/Kinesis
- aws_dimensions:
  - StreamName
  aws_metric_name: IncomingBytes
  aws_namespace: AWS/Kinesis
- aws_dimensions:
  - StreamName
  aws_metric_name: WriteProvisionedThroughputExceeded
  aws_namespace: AWS/Kinesis
- aws_dimensions:
  - StreamName
  aws_metric_name: ReadProvisionedThroughputExceeded
  aws_namespace: AWS/Kinesis
lambda.yml
region: us-east-1
metrics:
- aws_dimensions:
  - FunctionName
  - Resource
  aws_metric_name: Invocations
  aws_namespace: AWS/Lambda
- aws_dimensions:
  - FunctionName
  - Resource
  aws_metric_name: Errors
  aws_namespace: AWS/Lambda
- aws_dimensions:
  - FunctionName
  - Resource
  aws_metric_name: Duration
  aws_namespace: AWS/Lambda
- aws_dimensions:
  - FunctionName
  - Resource
  aws_metric_name: Throttles
  aws_namespace: AWS/Lambda
- aws_dimensions:
  - FunctionName
  - Resource
  aws_metric_name: ConcurrentExecutions
  aws_namespace: AWS/Lambda
- aws_dimensions:
  - FunctionName
  - Resource
  aws_metric_name: UnreservedConcurrentExecutions
  aws_namespace: AWS/Lambda
networkelb.yml
region: us-east-1
metrics:
- aws_dimensions:
  - AvailabilityZone
  - LoadBalancer
  - TargetGroup
  aws_metric_name: ActiveFlowCount
  aws_namespace: AWS/NetworkELB
  aws_statistics:
  - Average
- aws_dimensions:
  - AvailabilityZone
  - LoadBalancer
  - TargetGroup
  aws_metric_name: ActiveFlowCount_TCP
  aws_namespace: AWS/NetworkELB
  aws_statistics:
  - Average
- aws_dimensions:
  - AvailabilityZone
  - LoadBalancer
  - TargetGroup
  aws_metric_name: ActiveFlowCount_UDP
  aws_namespace: AWS/NetworkELB
  aws_statistics:
  - Average
- aws_dimensions:
  - AvailabilityZone
  - LoadBalancer
  - TargetGroup
  aws_metric_name: ClientTLSNegotiationErrorCount
  aws_namespace: AWS/NetworkELB
  aws_statistics:
  - Sum
- aws_dimensions:
  - LoadBalancer
  aws_metric_name: ConsumedLCUs
  aws_namespace: AWS/NetworkELB
  aws_statistics:
  - Average
- aws_dimensions:
  - LoadBalancer
  aws_metric_name: ConsumedLCUs_TCP
  aws_namespace: AWS/NetworkELB
  aws_statistics:
  - Average
- aws_dimensions:
  - LoadBalancer
  aws_metric_name: ConsumedLCUs_TLS
  aws_namespace: AWS/NetworkELB
  aws_statistics:
  - Average
- aws_dimensions:
  - LoadBalancer
  aws_metric_name: ConsumedLCUs_UDP
  aws_namespace: AWS/NetworkELB
  aws_statistics:
  - Average
- aws_dimensions:
  - AvailabilityZone
  - LoadBalancer
  - TargetGroup
  aws_metric_name: HealthyHostCount
  aws_namespace: AWS/NetworkELB
  aws_statistics:
  - Minimum
- aws_dimensions:
  - AvailabilityZone
  - LoadBalancer
  - TargetGroup
  aws_metric_name: NewFlowCount
  aws_namespace: AWS/NetworkELB
  aws_statistics:
  - Sum
- aws_dimensions:
  - AvailabilityZone
  - LoadBalancer
  - TargetGroup
  aws_metric_name: NewFlowCount_TCP
  aws_namespace: AWS/NetworkELB
  aws_statistics:
  - Sum
- aws_dimensions:
  - AvailabilityZone
  - LoadBalancer
  - TargetGroup
  aws_metric_name: NewFlowCount_TLS
  aws_namespace: AWS/NetworkELB
  aws_statistics:
  - Sum
- aws_dimensions:
  - AvailabilityZone
  - LoadBalancer
  - TargetGroup
  aws_metric_name: NewFlowCount_UDP
  aws_namespace: AWS/NetworkELB
  aws_statistics:
  - Sum
- aws_dimensions:
  - AvailabilityZone
  - LoadBalancer
  - TargetGroup
  aws_metric_name: ProcessedBytes
  aws_namespace: AWS/NetworkELB
  aws_statistics:
  - Sum
- aws_dimensions:
  - AvailabilityZone
  - LoadBalancer
  - TargetGroup
  aws_metric_name: ProcessedBytes_TLS
  aws_namespace: AWS/NetworkELB
  aws_statistics:
  - Sum
- aws_dimensions:
  - AvailabilityZone
  - LoadBalancer
  - TargetGroup
  aws_metric_name: ProcessedBytes_UDP
  aws_namespace: AWS/NetworkELB
  aws_statistics:
  - Sum
- aws_dimensions:
  - AvailabilityZone
  - LoadBalancer
  - TargetGroup
  aws_metric_name: ProcessedPackets
  aws_namespace: AWS/NetworkELB
  aws_statistics:
  - Sum
- aws_dimensions:
  - AvailabilityZone
  - LoadBalancer
  - TargetGroup
  aws_metric_name: TargetTLSNegotiationErrorCount
  aws_namespace: AWS/NetworkELB
  aws_statistics:
  - Sum
- aws_dimensions:
  - AvailabilityZone
  - LoadBalancer
  - TargetGroup
  aws_metric_name: TCP_Client_Reset_Count
  aws_namespace: AWS/NetworkELB
  aws_statistics:
  - Sum
- aws_dimensions:
  - AvailabilityZone
  - LoadBalancer
  - TargetGroup
  aws_metric_name: TCP_Target_Reset_Count
  aws_namespace: AWS/NetworkELB
  aws_statistics:
  - Sum
- aws_dimensions:
  - AvailabilityZone
  - LoadBalancer
  - TargetGroup
  aws_metric_name: UnHealthyHostCount
  aws_namespace: AWS/NetworkELB
  aws_statistics:
  - Maximum
rds.yml
region: us-east-1
metrics:
- aws_dimensions:
  - DBInstanceIdentifier
  aws_metric_name: BinLogDiskUsage
  aws_namespace: AWS/RDS
- aws_dimensions:
  - DBInstanceIdentifier
  aws_metric_name: DatabaseConnections
  aws_namespace: AWS/RDS
- aws_dimensions:
  - DBInstanceIdentifier
  aws_metric_name: FreeStorageSpace
  aws_namespace: AWS/RDS
- aws_dimensions:
  - DBInstanceIdentifier
  aws_metric_name: FreeableMemory
  aws_namespace: AWS/RDS
- aws_dimensions:
  - DBInstanceIdentifier
  aws_metric_name: ReadIOPS
  aws_namespace: AWS/RDS
- aws_dimensions:
  - DBInstanceIdentifier
  aws_metric_name: WriteIOPS
  aws_namespace: AWS/RDS
- aws_dimensions:
  - DBInstanceIdentifier
  aws_metric_name: ReadLatency
  aws_namespace: AWS/RDS
- aws_dimensions:
  - DBInstanceIdentifier
  aws_metric_name: WriteLatency
  aws_namespace: AWS/RDS
- aws_dimensions:
  - DBInstanceIdentifier
  aws_metric_name: ReadThroughput
  aws_namespace: AWS/RDS
- aws_dimensions:
  - DBInstanceIdentifier
  aws_metric_name: WriteThroughput
  aws_namespace: AWS/RDS
- aws_dimensions:
  - DBInstanceIdentifier
  aws_metric_name: CPUCreditUsage
  aws_namespace: AWS/RDS
- aws_dimensions:
  - DBInstanceIdentifier
  aws_metric_name: ReplicaLag
  aws_namespace: AWS/RDS
- aws_dimensions:
  - DBInstanceIdentifier
  aws_metric_name: CPUUtilization
  aws_namespace: AWS/RDS
- aws_dimensions:
  - DBInstanceIdentifier
  aws_metric_name: CPUCreditBalance
  aws_namespace: AWS/RDS
- aws_dimensions:
  - DBInstanceIdentifier
  aws_metric_name: DiskQueueDepth
  aws_namespace: AWS/RDS
- aws_dimensions:
  - DBInstanceIdentifier
  aws_metric_name: NetworkTransmitThroughput
  aws_namespace: AWS/RDS
- aws_dimensions:
  - DBInstanceIdentifier
  aws_metric_name: NetworkReceiveThroughput
  aws_namespace: AWS/RDS
- aws_dimensions:
  - DBInstanceIdentifier
  aws_metric_name: TransactionLogsDiskUsage
  aws_namespace: AWS/RDS
- aws_dimensions:
  - DBInstanceIdentifier
  aws_metric_name: SwapUsage
  aws_namespace: AWS/RDS
- aws_dimensions:
  - EngineName
  aws_metric_name: BinLogDiskUsage
  aws_namespace: AWS/RDS
- aws_dimensions:
  - EngineName
  aws_metric_name: DatabaseConnections
  aws_namespace: AWS/RDS
- aws_dimensions:
  - EngineName
  aws_metric_name: FreeStorageSpace
  aws_namespace: AWS/RDS
- aws_dimensions:
  - EngineName
  aws_metric_name: FreeableMemory
  aws_namespace: AWS/RDS
- aws_dimensions:
  - EngineName
  aws_metric_name: ReadIOPS
  aws_namespace: AWS/RDS
- aws_dimensions:
  - EngineName
  aws_metric_name: WriteIOPS
  aws_namespace: AWS/RDS
- aws_dimensions:
  - EngineName
  aws_metric_name: ReadLatency
  aws_namespace: AWS/RDS
- aws_dimensions:
  - EngineName
  aws_metric_name: WriteLatency
  aws_namespace: AWS/RDS
- aws_dimensions:
  - EngineName
  aws_metric_name: ReadThroughput
  aws_namespace: AWS/RDS
- aws_dimensions:
  - EngineName
  aws_metric_name: WriteThroughput
  aws_namespace: AWS/RDS
- aws_dimensions:
  - EngineName
  aws_metric_name: CPUCreditUsage
  aws_namespace: AWS/RDS
- aws_dimensions:
  - EngineName
  aws_metric_name: ReplicaLag
  aws_namespace: AWS/RDS
- aws_dimensions:
  - EngineName
  aws_metric_name: CPUUtilization
  aws_namespace: AWS/RDS
- aws_dimensions:
  - EngineName
  aws_metric_name: CPUCreditBalance
  aws_namespace: AWS/RDS
- aws_dimensions:
  - EngineName
  aws_metric_name: DiskQueueDepth
  aws_namespace: AWS/RDS
- aws_dimensions:
  - EngineName
  aws_metric_name: NetworkTransmitThroughput
  aws_namespace: AWS/RDS
- aws_dimensions:
  - EngineName
  aws_metric_name: NetworkReceiveThroughput
  aws_namespace: AWS/RDS
- aws_dimensions:
  - EngineName
  aws_metric_name: TransactionLogsDiskUsage
  aws_namespace: AWS/RDS
- aws_dimensions:
  - EngineName
  aws_metric_name: SwapUsage
  aws_namespace: AWS/RDS
- aws_dimensions:
  - DatabaseClass
  aws_metric_name: BinLogDiskUsage
  aws_namespace: AWS/RDS
- aws_dimensions:
  - DatabaseClass
  aws_metric_name: DatabaseConnections
  aws_namespace: AWS/RDS
- aws_dimensions:
  - DatabaseClass
  aws_metric_name: FreeStorageSpace
  aws_namespace: AWS/RDS
- aws_dimensions:
  - DatabaseClass
  aws_metric_name: FreeableMemory
  aws_namespace: AWS/RDS
- aws_dimensions:
  - DatabaseClass
  aws_metric_name: ReadIOPS
  aws_namespace: AWS/RDS
- aws_dimensions:
  - DatabaseClass
  aws_metric_name: WriteIOPS
  aws_namespace: AWS/RDS
- aws_dimensions:
  - DatabaseClass
  aws_metric_name: ReadLatency
  aws_namespace: AWS/RDS
- aws_dimensions:
  - DatabaseClass
  aws_metric_name: WriteLatency
  aws_namespace: AWS/RDS
- aws_dimensions:
  - DatabaseClass
  aws_metric_name: ReadThroughput
  aws_namespace: AWS/RDS
- aws_dimensions:
  - DatabaseClass
  aws_metric_name: WriteThroughput
  aws_namespace: AWS/RDS
- aws_dimensions:
  - DatabaseClass
  aws_metric_name: CPUCreditUsage
  aws_namespace: AWS/RDS
- aws_dimensions:
  - DatabaseClass
  aws_metric_name: ReplicaLag
  aws_namespace: AWS/RDS
- aws_dimensions:
  - DatabaseClass
  aws_metric_name: CPUUtilization
  aws_namespace: AWS/RDS
- aws_dimensions:
  - DatabaseClass
  aws_metric_name: CPUCreditBalance
  aws_namespace: AWS/RDS
- aws_dimensions:
  - DatabaseClass
  aws_metric_name: DiskQueueDepth
  aws_namespace: AWS/RDS
- aws_dimensions:
  - DatabaseClass
  aws_metric_name: NetworkTransmitThroughput
  aws_namespace: AWS/RDS
- aws_dimensions:
  - DatabaseClass
  aws_metric_name: NetworkReceiveThroughput
  aws_namespace: AWS/RDS
- aws_dimensions:
  - DatabaseClass
  aws_metric_name: TransactionLogsDiskUsage
  aws_namespace: AWS/RDS
- aws_dimensions:
  - DatabaseClass
  aws_metric_name: SwapUsage
  aws_namespace: AWS/RDS
redshift.yml
region: us-east-2
metrics:
- aws_dimensions:
  - ClusterIdentifier
  - NodeID
  aws_metric_name: HealthStatus
  aws_namespace: AWS/Redshift
- aws_dimensions:
  - ClusterIdentifier
  - NodeID
  aws_metric_name: CPUUtilization
  aws_namespace: AWS/Redshift
- aws_dimensions:
  - ClusterIdentifier
  - NodeID
  aws_metric_name: DatabaseConnections
  aws_namespace: AWS/Redshift
- aws_dimensions:
  - ClusterIdentifier
  - NodeID
  aws_metric_name: MaintenanceMode
  aws_namespace: AWS/Redshift
- aws_dimensions:
  - ClusterIdentifier
  - NodeID
  aws_metric_name: NetworkReceiveThroughput
  aws_namespace: AWS/Redshift
- aws_dimensions:
  - ClusterIdentifier
  - NodeID
  aws_metric_name: NetworkTransmitThroughput
  aws_namespace: AWS/Redshift
- aws_dimensions:
  - ClusterIdentifier
  - NodeID
  aws_metric_name: ReadIOPS
  aws_namespace: AWS/Redshift
- aws_dimensions:
  - ClusterIdentifier
  - NodeID
  aws_metric_name: WriteIOPS
  aws_namespace: AWS/Redshift
- aws_dimensions:
  - ClusterIdentifier
  - NodeID
  aws_metric_name: ReadLatency
  aws_namespace: AWS/Redshift
- aws_dimensions:
  - ClusterIdentifier
  - NodeID
  aws_metric_name: WriteLatency
  aws_namespace: AWS/Redshift
- aws_dimensions:
  - ClusterIdentifier
  - NodeID
  aws_metric_name: ReadThroughput
  aws_namespace: AWS/Redshift
- aws_dimensions:
  - ClusterIdentifier
  - NodeID
  aws_metric_name: WriteThroughput
  aws_namespace: AWS/Redshift
- aws_dimensions:
  - ClusterIdentifier
  - NodeID
  aws_metric_name: QueryDuration
  aws_namespace: AWS/Redshift
- aws_dimensions:
  - ClusterIdentifier
  - NodeID
  aws_metric_name: QueriesCompletedPerSecond
  aws_namespace: AWS/Redshift
- aws_dimensions:
  - ClusterIdentifier
  - NodeID
  aws_metric_name: PercentageDiskSpaceUsed
  aws_namespace: AWS/Redshift
s3.yml
region: us-east-1
metrics:
- aws_dimensions:
  - BucketName
  - FilterId
  aws_metric_name: 4xxErrors
  aws_namespace: AWS/S3
- aws_dimensions:
  - BucketName
  - FilterId
  aws_metric_name: 5xxErrors
  aws_namespace: AWS/S3
- aws_dimensions:
  - BucketName
  - FilterId
  aws_metric_name: AllRequests
  aws_namespace: AWS/S3
- aws_dimensions:
  - BucketName
  - FilterId
  aws_metric_name: FirstByteLatency
  aws_namespace: AWS/S3
- aws_dimensions:
  - BucketName
  - FilterId
  aws_metric_name: TotalRequestLatency
  aws_namespace: AWS/S3
- aws_dimensions:
  - BucketName
  - FilterId
  aws_metric_name: BytesDownloaded
  aws_namespace: AWS/S3
- aws_dimensions:
  - BucketName
  - FilterId
  aws_metric_name: BytesUploaded
  aws_namespace: AWS/S3
- aws_dimensions:
  - BucketName
  - FilterId
  aws_metric_name: PutRequests
  aws_namespace: AWS/S3
- aws_dimensions:
  - BucketName
  - FilterId
  aws_metric_name: ListRequests
  aws_namespace: AWS/S3
- aws_dimensions:
  - BucketName
  - FilterId
  aws_metric_name: HeadRequests
  aws_namespace: AWS/S3
- aws_dimensions:
  - BucketName
  - FilterId
  aws_metric_name: GetRequests
  aws_namespace: AWS/S3
- aws_namespace: AWS/S3
  aws_metric_name: BucketSizeBytes
  aws_dimensions: [BucketName, StorageType]
  range_seconds: 172800
  period_seconds: 86400
  set_timestamp: false
- aws_namespace: AWS/S3
  aws_metric_name: NumberOfObjects
  aws_dimensions: [BucketName, StorageType]
  range_seconds: 172800
  period_seconds: 86400
  set_timestamp: false
  # In case you want to use some bucket level Tag to select buckets to monitor,
  # or to have additional `info` metric with all bucket Tags as labels, use `aws_tag_select`:
  aws_tag_select:
    tag_selections:
      Monitoring: ["enabled"]
    resource_type_selection: "s3:"
    resource_id_dimension: BucketName
ses.yml
region: us-east-1
metrics:
- aws_namespace: AWS/SES
  aws_metric_name: Bounce
  aws_dimensions: []
  aws_statistics: []
- aws_namespace: AWS/SES
  aws_metric_name: Complaint
  aws_dimensions: []
  aws_statistics: []
- aws_namespace: AWS/SES
  aws_metric_name: Delivery
  aws_dimensions: []
  aws_statistics: []
- aws_namespace: AWS/SES
  aws_metric_name: Reputation.BounceRate
  aws_dimensions: []
  aws_statistics: []
- aws_namespace: AWS/SES
  aws_metric_name: Reputation.ComplaintRate
  aws_dimensions: []
  aws_statistics: []
- aws_namespace: AWS/SES
  aws_metric_name: Send
  aws_dimensions: []
  aws_statistics: []
- aws_namespace: AWS/SES
  aws_metric_name: Reject
  aws_dimensions: []
  aws_statistics: []
sns.yml
region: us-east-1
metrics:
- aws_dimensions:
  - TopicName
  - Platform
  aws_metric_name: NumberOfMessagesPublished
  aws_namespace: AWS/SNS
  aws_statistics:
  - Sum
- aws_dimensions:
  - TopicName
  - Platform
  aws_metric_name: NumberOfNotificationsDelivered
  aws_namespace: AWS/SNS
  aws_statistics:
  - Sum
- aws_dimensions:
  - TopicName
  - Platform
  aws_metric_name: NumberOfNotificationsFailed
  aws_namespace: AWS/SNS
  aws_statistics:
  - Sum
- aws_dimensions:
  - TopicName
  - Platform
  aws_metric_name: PublishSize
  aws_namespace: AWS/SNS
  aws_statistics:
  - Average
  - Sum
  - Maximum
  - Minimum
  - Count
- aws_dimensions:
  - TopicName
  - Platform
  aws_metric_name: NumberOfNotificationsFilteredOut
  aws_namespace: AWS/SNS
  aws_statistics:
  - Sum
sqs.yml
region: us-east-1
metrics:
- aws_dimensions:
  - QueueName
  aws_metric_name: NumberOfMessagesSent
  aws_namespace: AWS/SQS
  aws_statistics:
  - Average
  - Minimum
  - Maximum
  - SampleCount
  - Sum
- aws_dimensions:
  - QueueName
  aws_metric_name: NumberOfMessagesReceived
  aws_namespace: AWS/SQS
  aws_statistics:
  - Average
  - Minimum
  - Maximum
  - SampleCount
  - Sum
- aws_dimensions:
  - QueueName
  aws_metric_name: NumberOfEmptyReceives
  aws_namespace: AWS/SQS
  aws_statistics:
  - Average
  - Minimum
  - Maximum
  - SampleCount
  - Sum
- aws_dimensions:
  - QueueName
  aws_metric_name: NumberOfMessagesDeleted
  aws_namespace: AWS/SQS
  aws_statistics:
  - Average
- aws_dimensions:
  - QueueName
  aws_metric_name: ApproximateNumberOfMessagesDelayed
  aws_namespace: AWS/SQS
  aws_statistics:
  - Average
  - Minimum
  - Maximum
  - SampleCount
  - Sum
- aws_dimensions:
  - QueueName
  aws_metric_name: ApproximateAgeOfOldestMessage
  aws_namespace: AWS/SQS
  aws_statistics:
  - Average
  - Minimum
  - Maximum
  - SampleCount
  - Sum
- aws_dimensions:
  - QueueName
  aws_metric_name: ApproximateNumberOfMessagesNotVisible
  aws_namespace: AWS/SQS
  aws_statistics:
  - Average
  - Minimum
  - Maximum
  - SampleCount
  - Sum
- aws_dimensions:
  - QueueName
  aws_metric_name: ApproximateNumberOfMessagesVisible
  aws_namespace: AWS/SQS
  aws_statistics:
  - Average
  - Minimum
  - Maximum
  - SampleCount
  - Sum
- aws_dimensions:
  - QueueName
  aws_metric_name: SentMessageSize
  aws_namespace: AWS/SQS
  aws_statistics:
  - Average
  - Minimum
  - Maximum
  - SampleCount
  - Sum