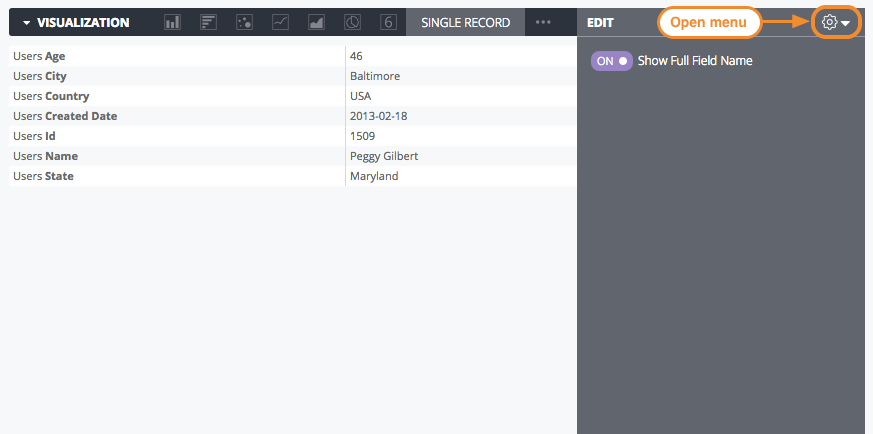
[[["易于理解","easyToUnderstand","thumb-up"],["解决了我的问题","solvedMyProblem","thumb-up"],["其他","otherUp","thumb-up"]],[["很难理解","hardToUnderstand","thumb-down"],["信息或示例代码不正确","incorrectInformationOrSampleCode","thumb-down"],["没有我需要的信息/示例","missingTheInformationSamplesINeed","thumb-down"],["翻译问题","translationIssue","thumb-down"],["其他","otherDown","thumb-down"]],["最后更新时间 (UTC):2025-09-04。"],[],[],null,["# Single Record chart options\n\n| **Note:** This page describes visualization options for Looker. For information about Looker Studio visualizations, see [Types of charts in Looker Studio](/looker/docs/studio/types-of-charts-in-looker-studio).\n\nTo select a single record chart, click the ellipses (...) on the Visualization menu bar and select **Single Record** . Click **Edit** in the upper right corner of the visualization tab to format your visualization.\n\nSome of the options that are listed on this documentation page may be grayed out or hidden when they conflict with other settings that you have chosen.\n\nEdit menu options\n-----------------\n\n### Show Full Field Name\n\nYou can determine whether to show the view name along with the field name for each axis title and series name. When **Show Full Field Name** is turned off, generally only the field name shows; however, measures of type `count` display only the view name instead."]]