Dokumen ini menjelaskan cara membuat daftar dan memetakan metrik berbasis log menggunakan konsolGoogle Cloud . Untuk mengetahui informasi tentang cara membuat metrik berbasis log, lihat Mengonfigurasi metrik penghitung dan Mengonfigurasi metrik distribusi.
Sebelum memulai
Pastikan peran Identity and Access Management Anda mencakup izin yang diperlukan untuk membuat dan melihat metrik berbasis log, serta membuat kebijakan pemberitahuan. Untuk mengetahui detailnya, lihat Izin untuk metrik berbasis log.
Mencantumkan metrik berbasis log
Untuk melihat daftar metrik berbasis log untuk project Google Cloud Anda, lakukan hal berikut:
-
Di konsol Google Cloud , buka halaman Log-based Metrics:
Jika Anda menggunakan kotak penelusuran untuk menemukan halaman ini, pilih hasil yang subjudulnya adalah Logging.
Pilih project Google Cloud yang ada. Antarmuka metrik berbasis log menampilkan dua daftar jenis metrik: Metrik sistem dan Metrik yang ditentukan pengguna.
Panel Metrik yang ditentukan pengguna di antarmuka metrik berbasis log memiliki beberapa fitur untuk membantu Anda mengelola metrik yang ditentukan pengguna di projectGoogle Cloud Anda:
Tabel metrik yang ditentukan pengguna mencakup kolom Nama, Deskripsi, Jenis, dan Filter. Kolom ini ditentukan saat Anda membuat metrik.
Panel Filter metrik yang ditentukan pengguna memungkinkan Anda memfilter daftar metrik dengan penelusuran teks atau Nama, Deskripsi, dan Filter metrik.
Tabel metrik yang ditentukan pengguna mencakup kolom untuk Penggunaan bulan sebelumnya dan Penggunaan hingga saat ini (MTD). Data penggunaan ini berguna, misalnya, jika Anda ingin menentukan metrik mana yang menyerap paling banyak data atau untuk memperkirakan tagihan.
Menu Lainnya more_vert untuk setiap metrik di panel metrik buatan pengguna berisi fitur tambahan untuk mengelola metrik Anda:
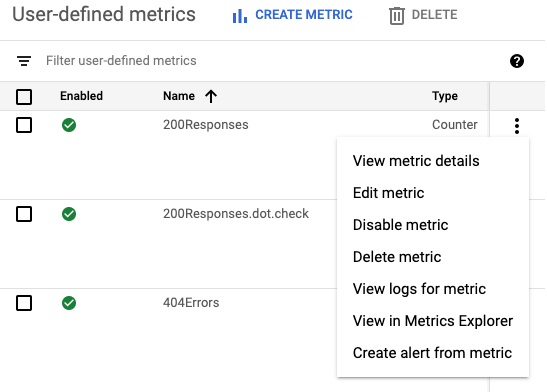
- Melihat detail metrik: Menampilkan Nama, Jenis, Deskripsi, Filter, Unit, dan Label metrik, jika ditentukan.
- Edit metrik: Memungkinkan Anda mengedit kolom tertentu untuk metrik.
- Nonaktifkan metrik: Memungkinkan Anda menghentikan penghitungan metrik. Anda dapat mengaktifkan kembali metrik yang dinonaktifkan dari menu yang sama.
- Hapus metrik: Memungkinkan Anda menghapus metrik.
- Lihat log untuk metrik: Membuka Logs Explorer dan mengisi filter metrik di Pembuat kueri serta menjalankan kueri.
- Lihat di Metrics Explorer: Memungkinkan Anda membuat diagram metrik.
- Buat pemberitahuan dari metrik: Memungkinkan Anda mengonfigurasi notifikasi saat metrik berbasis log cocok dengan kriteria yang Anda tentukan. Untuk mengetahui informasi selengkapnya, lihat Pemberitahuan tentang metrik berbasis log.
Membuat diagram metrik berbasis log
Untuk membuat diagram metrik berbasis log, lakukan tindakan berikut:
-
Di konsol Google Cloud , buka halaman Log-based Metrics:
Jika Anda menggunakan kotak penelusuran untuk menemukan halaman ini, pilih hasil yang subjudulnya adalah Logging.
Temukan metrik yang ingin Anda lihat, lalu pilih Lihat di Metrics Explorer dari menu more_vert Lainnya metrik.
Metrics Explorer akan terbuka dan telah dikonfigurasi sebelumnya untuk Anda. Namun, Anda mungkin ingin mengubah beberapa setelan diagram.
Misalnya, screenshot berikut menampilkan diagram metrik sistem dengan nama
byte_countuntuk project Google Cloud tertentu: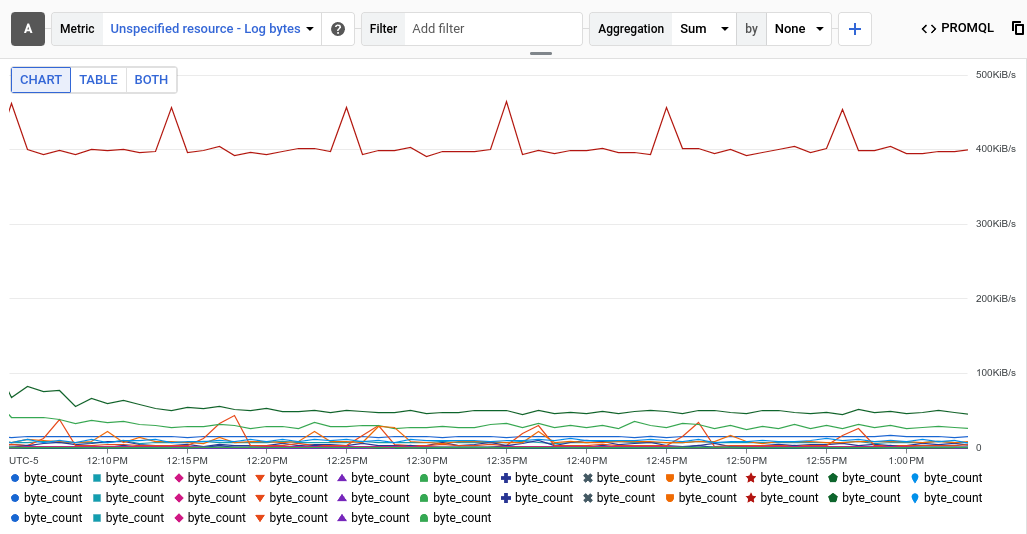
Entri Agregasi menunjukkan bahwa setiap deret waktu pada diagram adalah jumlah byte yang ditulis ke log tertentu. Dalam contoh sebelumnya, project berisi beberapa log, sehingga diagram menampilkan beberapa deret waktu.
Untuk melihat data untuk log tertentu, tambahkan filter. Misalnya, untuk melihat metrik
byte_countuntuk entri log yang ditulis oleh BigQuery, klik Tambahkan filter, pilih log, lalu pilih entri BigQuery. Diagram kini menampilkan satu deret waktu, yang menunjukkan total byte log yang ditulis oleh BigQuery. Jika Anda ingin melihat metrikbyte_countmenurut tingkat keparahan entri log, ubah menu kedua di entri Agregasi dari Tidak ada menjadi Tingkat Keparahan. Diagram berikut menunjukkan metrikbyte_countyang ditampilkan menurut tingkat keparahan untuk log yang ditulis oleh BigQuery: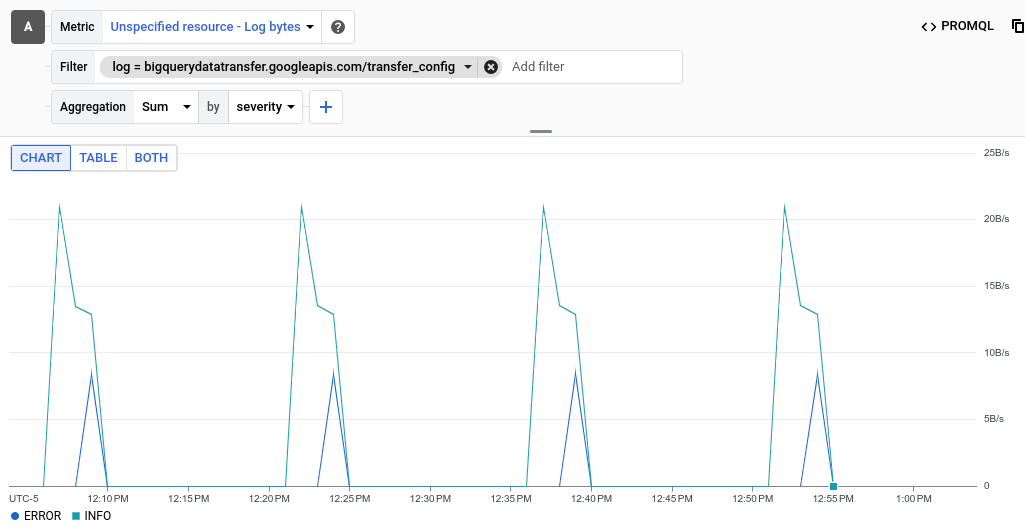
Untuk metrik berbasis log bernilai distribusi, luaskan Diagram garis dan pilih Diagram peta panas.
Untuk mengetahui informasi selengkapnya tentang metrik nilai distribusi, lihat Metrik distribusi dan Persentil dan metrik nilai distribusi.
Opsional: Untuk menyimpan diagram sebagai referensi di masa mendatang, klik Simpan diagram di toolbar, lalu selesaikan dialog. Anda dapat menyimpan diagram ke dasbor yang ada atau membuat dasbor baru.
Langkah berikutnya
- Untuk membuat kebijakan pemberitahuan untuk metrik berbasis log, lihat Pemberitahuan pada metrik berbasis log.
Untuk mengetahui informasi selengkapnya tentang membuat diagram data metrik, lihat Referensi pemantauan berikut: